Foreword
Just so that we are clear about it: searching for which statistical model to use or which statistical test to perform on your data is NOT something to do once you have gathered your data, but it is something that is part of the design of your experiment to come! That being said, it is unfortunately common knowledge that the quest for the right model/test often starts at the last moment... when results need to be interpreted.
The content of this page is based on the assumption that you are in the design phase of the study. Nonetheless, you will find it useful also if you are looking for help when analysing an existing data set.
This key will help you define which model or family of models you may use to analyze your data. For using this tool, you have to know whether your data is clustered or not, which distribution describes it, which type(s) of variables are present. You will find more info about variables, data clustering, distribution and hypothesis formulation further below.
Univariate analysis refers to the simplest form of statistical analysis where a single response variable is considered. In this type of analysis, you investigate whether that single response variable is affected by one or several predictor variables.
Choose now between gaussian/normal and non-normal distribution.
See HERE for more info on Data Distribution
Choose now between Data Clustering and No Data Clustering.
See HERE for more info on Data Clustering (Dependency).
It is recommended that you proceed with a Linear Model (LM).
It is recommended that you proceed with a Linear Mixed-Effects Model (LME).
Choose now between Data Clustering and No Data Clustering.
See HERE for more info on Data Clustering (Dependency).
It is recommended that you proceed with a Generalized Linear Model (GLM).
It is recommended that you proceed with a Generalized Linear Mixed Model (GLMM).
Multivariate analysis refers to a more advanced type of analysis where at least two response variables are considered simultaneously. In this type of analysis, you investigate the relationship between these response variables and how they behave as a function of predictor variables.
UNDER CONSTRUCTION
Formulate a Hypothesis
The first and possibly most important question when planning an experiment with subsequent data analysis is "what is the working hypothesis?". Often, the experimenter formulates the hypothesis that there exists a difference, a relationship or a correlation between two or more groups based on at least one variable. It is this hypothesis (called H1) which will determine the design of the experiment, the population(s) to study, the groups or treatments, the variables, etc. If the hypothesis is not formulated correctly or unclear, chances are great that the experimental design (and data collection) will be sub-optimal, or even inadequate, and that parts of the study (at best) will be discarded. Hence our strong advice: clearly state your hypothesis! Once you have done it, you "logically" have the null hypothesis H0, i.e. the hypothesis that the difference, relationship or correlation that you "hope for" does not exist. And this is that null hypothesis H0 that most statistical tests take as a starting point.
Example1:
- H1: the average size of Benthosema glaciale is different in Masfjorden and Lustrafjorden
- H0: the average size of Benthosema glaciale is NOT different in Masfjorden and Lustrafjorden
Example2:
- H1: the reproductive success of the bean beetle Callosobruchus maculatus increases with temperature.
- H0: the reproductive success of the bean beetle Callosobruchus maculatus does NOT increase with temperature.
Note that, in this case, the experimenter investigates the impact of temperature on the reproductive success of the bean beetle. The formulation of H1 is particular since it states that the effect is limited to an increase, not a difference (decrease AND increase). Thus, the experimenter must reject H1 and accept H0 if the results show either a decrease, or an absence of effect.
Know Your Variables
It is essential to understand what type of variable(s) you are dealing with and which use you will make of it before starting the analysis. Variable types are numerous: predictor, response, continuous, ordinal, dependent, independent, continuous, etc. and some of these terms are synonymous.
The choice of a statistical test or model depends on several factors, one of which being the type of variable that defines your predictor and response variables. Variables may be split into two categories: categorical or continuous. Note that the variable type is sometimes tricky to determine...
Categorical variables are variables which have only a limited/finite number of values. They are often called discrete or discontinuous variables. All qualitative variables are categorical. There are several types of categorical variables: nominal, ordinal/ranked, dichotomous or binary.
Nominal variables
A nominal variable has two or more categories or levels. These levels cannot be ranked, nor do they follow a specific order.
Example 1: "blue", "red" and "yellow" are the three levels of the variable "primary color".
Example 2: "Oslo", "Bergen", "Trondheim", "Stavanger" are four levels of the variable "Norwegian cities".
Ordinal/Ranked variables
A ranked or ordinal variable is a nominal variable which levels can be ordered or ranked.
Example 1: "Low", "Medium" and "High" are three ranked levels of the variable "Intensity".
Example 2: "A", "B", "C", "D", "E" and "F" are six ranked levels of "Grade".
Example 3: "Monday", "Tuesday", "Wednesday", "Thursday", "Friday, "Saturday" and "Sunday" are the time-ordered levels of the variable "Weekdays".
Dichotomous/Binary variables
A dichotomous variable is a variable that can only take 2 values. A binary variable is a specific type of dichotomous variable where the values taken are either 0 or 1.
Example 1: "TRUE" vs. "FALSE".
Example 2: "Passed" vs. "Failed".
Example 3: "0" vs. "1".
Continuous variables are variables which can take an infinite number of values. Continuous variables are quantitative, but note that not all quantitative variables are continuous.
Interval variables
Interval variables are variables which have numerical values and which are measured along a continuum, but which 0 value is not meaningful (i.e. the value 0 does not depict the absence of measured variable, it is rather a reference value).
Example 1: pH is a numerical scale that describes the acidity/alkalinity of a solution. A pH equal to 0 does not mean that there is no acidity. Thus, pH is an interval variable.
Example 2: temperature measured in Fahrenheit or Celsius is an interval variable since the value 0 is a reference point, not the absence of temperature.
Ratio variables
Ratio variables are interval variables for which the value 0 is meaningful (i.e. the value 0 depicts the absence of the measured variable).
Example 1: length/distance. If an object has moved by a distance of 0 meter, the displacement was null. Distance is thus a ratio variable.
Example 2: temperature measured in Kelvin is a ratio variable since the value 0 shows absence of thermal motion.
From time to time, it is difficult to know whether a variable should be treated as continuous or categorical. In specific cases, one may take some liberty when determining the variable type to attribute before starting an analysis. Below are a few examples of tricky variables.
Count data
Count data consist of non-negative integers only. Thus it is not continuous and must be treated as a categorical variable.
Year
Time expressed in years (ex: 2019) may be considered as a categorical (ordinal) variable as each value is in fact a label that represents or sums up an entire year.
Likert scale
The Likert scale is a scale ranging from 1 to 5, alternatively 1 to 7 (but other ranges exist), which is used in questionnaires where respondents shall rate for example to which degree he or she agrees to an assertion. The answers corresponding to this rating scale may look like this: Agree, Somewhat Agree, Neutral, Somewhat Disagree, Disagree). This scale is an ordinal variable.
In statistical models, we may differentiate variables based on the way we use them. Both categorical and continuous variables may thus serve as response or predictor variable. The response variable is the variable that changes as a function of the predictor variable(s).
Predictor variables are also called controlled, manipulated, independent or input variables. Response variables are also called measured, explained, experimental, dependent or output variables.
Example: a study aims at evaluating the effect of different food diets om fish growth and measures bodyweight at different timepoints during the season. Here, both time and diet are predictor variables, while bodyweight is the only response variable.
Data Clustering/Dependency
Before starting the analysis, you must determine whether there may exist a form of dependency or clustering in your data, meaning that the values of some observations are dependent due to, for example, experimental design or sampling conditions. Here, the question is whether there is a clustering factor that may be responsible for coordinated variation of a measured variable(s) in several observations. Remember that this is of great importance when choosing a model for your analysis, since some models assume that observations are independent, while others accept dependency.
Nested design is a typical example of clustering. Let's consider a study where the number of eggs laid by 10 female hawks is measured at three different locations during a unique season. Each hawk is found at a specific location and it is plausible that most, if not all hawks from a single location are affected by local conditions (food availability, human presence, etc) which may have an effect on the reproductive capacity of those birds. Thus each location is a cluster and observations within each cluster must be considered as dependent.
Repeated measurement is also a typical example of clustering. Let's consider a study involving several rats which bodyweight is measured at regular intervals. Since individual rats might have different growth rates for various reasons (dominant behavior, health conditions, etc), all measurements specific to one individual are dependent and the individual itself is the cluster.
Determine the Data Distribution
Another essential feature of your data that is crucial when choosing a statistical model or test is its distribution. Often, you will see that the data follows a normal/gaussian. Non-normal distributions include poisson or binomial distribution. Here is more info about them.
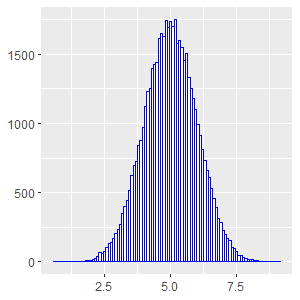 Normal distribution, also called Gaussian- or bell-shaped distribution, is certainly the most common distribution in statistics. Normal distributions are related to continuous variables, and have no bounds (they may take any value between -∞ and +∞).
Several of the most frequently used statistical tests such as Student's t-test and ANOVA rely on the assumption that the data is normally distributed. The Shapiro-Wilks test is a common test for normality of a sample. A Q-Q plot may also be used to visually assess distribution normality.
Note that the shape of distribution does not change, unlike Poisson and binomial distributions.
A Poisson distribution is encountered when handling discrete numerical variables such as count variables (i.e. variables that describe the frequency/occurrence of an event). Count variables are discrete variables bounded at 0, meaning that they may take any countable value between 0 and +∞, but cannot be negative.
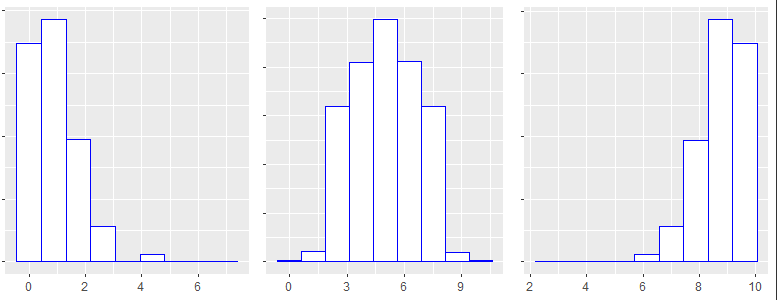
The shape of a Poisson distribution is not fixed, but varies with the sample mean, unlike the normal distribution which remains symmetric regardless of the sample mean). It may be skewed when the mean is low, highly-skewed when the mean is close to zero, or even close to the shape of a normal distribution when the mean is large enough.
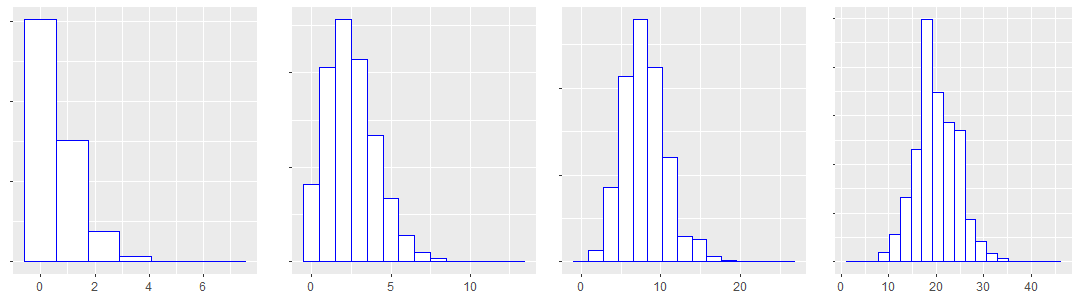
Binomial distribution are often linked to experiments consisting of a finite number of trials for which the outcome is either success or failure, and where the probability p of success/failure is determined. The binomial distribution reflects the probability of reaching a goal after N trials for a given success probability.
As for a Poisson distribution, a binomial distribution describes the behavior of a discrete variable, but it has both zero as a lower bound and an upper bound (finite number of trials). The shape of a binomial distribution, unlike a normal distribution, may vary.