AB-202 Marine Arctic Biology

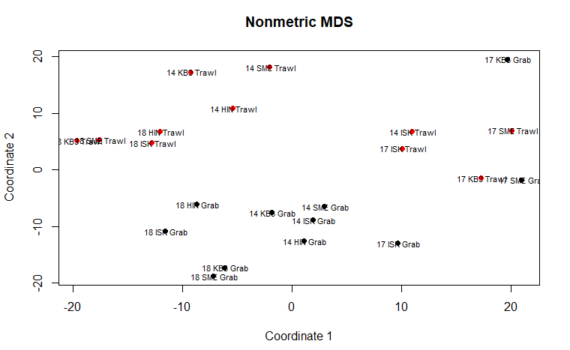
We can perform many methods to visualize and analyze multivarate data. In the tutorial you can find scripts and a short description to 3 of the most commonly used ones: Cluster analysis Multi dimensional scaling (MDS) PCR/RDA In this post, we will go through Multidiemnsional Scaling – or short MDS. […]
We can perform many methods to visualize and analyze multivarate data. In the tutorial you can find scripts and a short description to 3 of the most commonly used ones: Cluster analysis Multi dimensional scaling (MDS) PCR/RDA In this post, we will look at Principal Component Analysis (PCR) and RDA. […]
5.5 Multivariate analysis – PCA/RDA
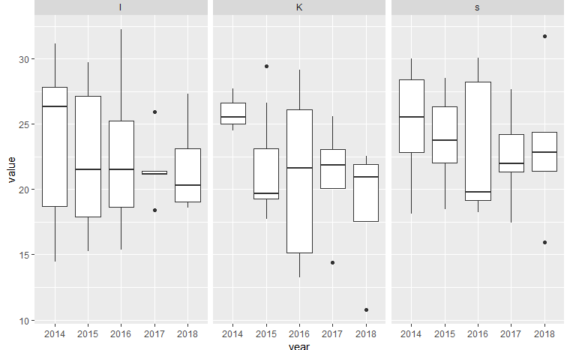
Below, you will find some examples of plots and scripts that are relevant for some of your projects. There is also an own section on ggplot in bioSTATS, and at the ggplot web-page. Example 1: Polar cod contribution to fish community For the plots below you will need the […]
6.3 Example scripts for some plots
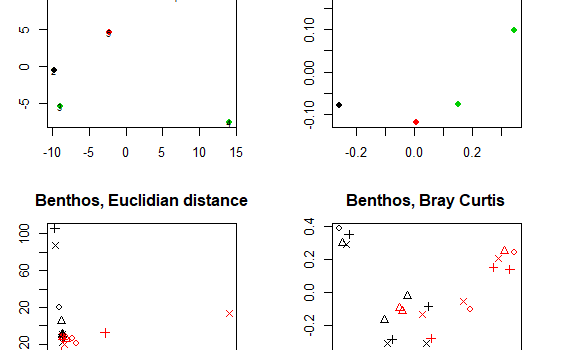
We can perform many methods to visualize and analyze multivarate data. In the tutorial you can find scripts and a short description to 3 of the most commonly used ones: Cluster analysis Multi dimensional scaling (MDS) PCR/RDA In this post, we will go through Cluster analysis. For each method, there […]
5.3 Multivariate analysis and visualization – Cluster analysis
[code language=”r”] ##### inspect data #### #inspect summary stats summary(Data_in2) #max, min,median, mean summary(Data_in) #max, min,median, mean range(B_taxa) #max & min values in whole dataset range(Data_in) #you will get an error message: this only works if the dataframe contains only numeric values #The amount of 0s in your dataset can […]
5.1 Example script (Inspect & standardize/transform data)
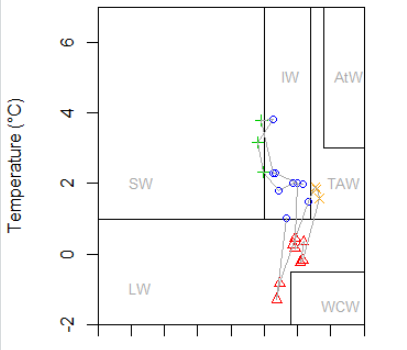
The CTD data we are using comes in different formats. The .cnv files can be converted to text files by opening the .cnv files in notepad (this option comes up if you choose to use the standard Windows service) and then save them as text files. CTD files obtained […]
5.2 CTD data
Introduction on many basics are covered other places in the R-tutorial. I encourage you to look around there if you need help with basic operations. Still, below I mention some basics that you will need. Creating objects R treats our data as objects. They can be single vectors, matrices, lists […]
4.2 Some basics
[code language=”r”]#set working directory setwd("C:/Users/x/OneDrive/AB202 vår 2019/R") ################ import data and preparations ##### # for data import, make sure that the file path is correct #import from text file (export as text from excel file first, tabulator deliniated)### Data_in<-read.table("C:/Users/x/OneDrive/AB202 vår 2019/R/AB202fish_poster.txt", header=TRUE, sep="\t", dec=",") Data_in<-read.table("C:/Users/x/OneDrive/AB202 vår 2019/R/AB202benthos_poster.txt", header=TRUE, sep="\t", dec=",") […]
3.5 Example script

The two main way of interacting with R are the console or script files. I recommend using the editor to write, edit, annotate and SAVE your script for later use. This way, you will have a record of what you did. You can easily re-run the whole or parts of […]
4.1 Good practices
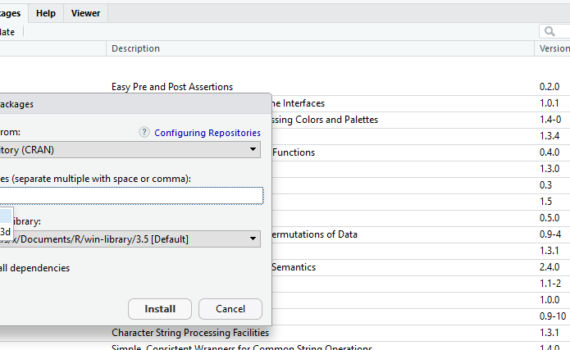
A package is collection of functions and data sets, which has been developed by advanced users and programmers of the R-community. Packages make working with R a lot easier. In ecology, we often use advanced statistical analysis. Building the functions and required procedures from scratch would require a long list […]
3.4 Install and open required packages
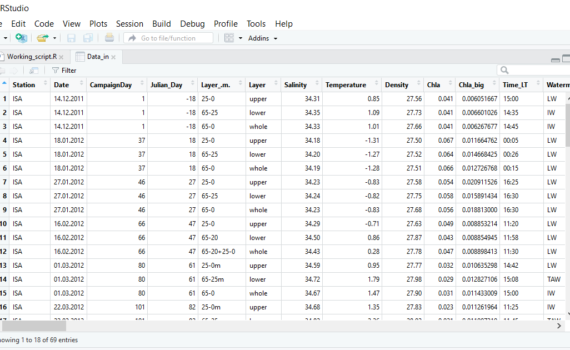
R reads data as objects. For example number, vector, dataframe or matrix. I our case, we will mainly work with dataframes. There are several ways of importing data from text, csv or excel files, which are described here using R without R-Studio. I recommend importing from text files (.txt). If […]
3.3 Load/import your data into R-studio
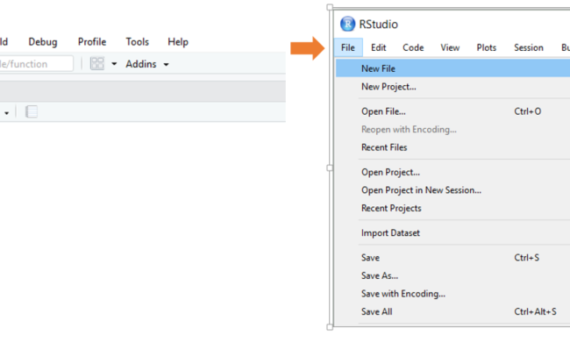
When open R-Studio, the first thing you should do is open a new script or an existing script. To open a new script, you can either go via “File – New file – R-Script”, the -button (choose R-Script) or keyboard shortcut “Ctrl+Shift+N”. To open an existing file, you can either […]
3.1 Open a script/start a new one and SAVE it
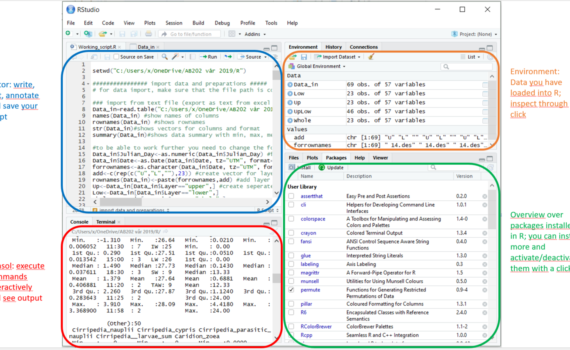
In the course, we are using R with the R-Studio interface. To install R-studio: 1. download and install R, 2. Download the right R-Studio Desktop Open Source License version 3. Follow the typical install procedure. R in R-Studio can be used like R without the interface but provides us with […]
2 Using R in R-Studio – Short intro to R-Studio
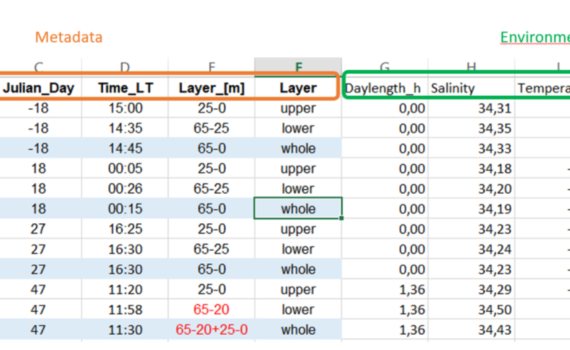
When preparing your data for use in R, there are several things you need to think of with regards to what R can understand and likes/doesn’t like in a data-file you want to import. The data we will work with is organized in a spread-sheet. The top row should contain […]
1.2 Prepare your data – Do’s and don’ts in data preparation for R
When preparing and gathering the data for you project, the most important thing is which question do you want to ask and how you want to answer it. Start with a question you are interested in. From there, ask what data do you need to answer the question. The data […]
