
A dataframe looks like a two-dimensional matrix. However, unlike a matrix, a dataframe can contain more than numerical values. You can also fill in columns with text values and boolean/logical values (TRUE and FALSE). In a dataframe, the variables, dependent and independent, are placed in columns, while the rows represent the observations. When preparing your dataframe prior to importing it into R, you must keep in mind that all data elements belonging to a same variable are placed in the same column, regardless of which sample or experimental groups they belong to.
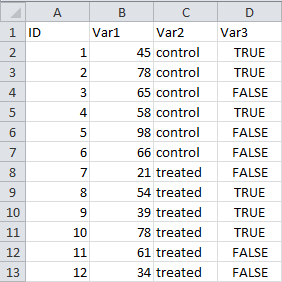 The picture to the right illustrates what a “good” dataframe looks like. It contains 4 variables in 4 columns (
ID, Var1, Var2 and Var3), and each variable is represented in only one column; it contains also 12 observations in 12 rows (one per row), and the 13th row (at the top) contains the headers (or variable names).
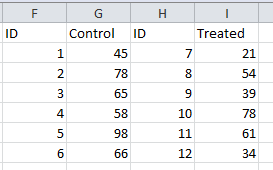 The following example illustrates what is NOT a dataframe. The content of the table may look valid and scientifically correct; however, the way the data elements are organized does not match the requirements of a dataframe because the measurements of the variable (numerical values) are not in the same column, but in two separate columns based on the experimental group they originated from. In addition, there are also two different columns for the variable
 ID and each of the 6 rows contains two observations, not just one as expected.
If you want to do thing correctly, you need to rewrite the table so that the names of the group to which the observation belongs are in the same column (and thus come under the variable name group) and the measurements are displayed in a second, but same column (and thus come under the same variable name measurement).