
Working with small datasets or tables, it is usually easy to spot a mistake, a typo, a value that is much larger than the rest (potential outlier?), a cell format which is wrong or the result of a formula that is invalid. Here are two obvious examples of mistakes that can easily be found.
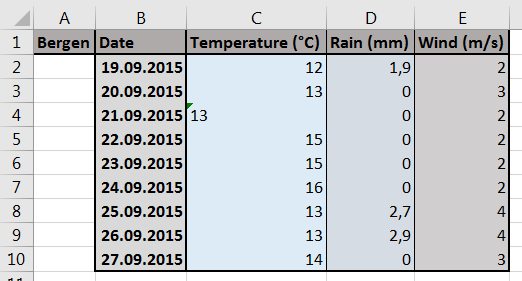 In the example to the right, the cell C4 does not have the same format as the rest of the dataset (text instead of number); as a consequence, the cell content appears left-aligned. This means that the result of operations (such as calculations and formulas) including the content of C4 will not be correct as the content of C4 will not be considered.
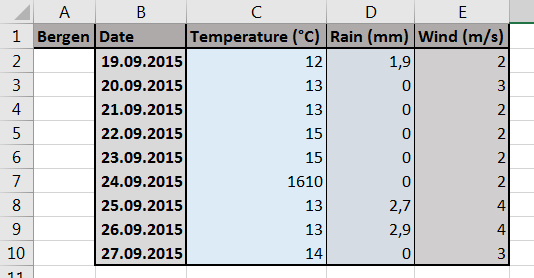 In this second example to the right, the cell C7 contains an obvious mistake/typo. The data exceeds by far the temperature that one could expect in Bergen (or anywhere else on the planet) and should be correct before further operation. Luckily, the number is large and easily spotted in this small table.
Unfortunately, your dataset will often be large, with many parameters/variables, and you won’t have time to visually check for such problems. As a result, your calculations and charts will be incorrect, certainly ruining all your hopes for a happy-ending.
In the next few posts, we will see how to reveal such mistakes using charts or filters, and a little bit of reasoning.