
Two functions are available to add text or notes to your chart: text() and mtext(). Use text() if the text must appear in the graph area, but use mtext() if the text is to be placed in one of the margins. The arguments are location, pos (for the position relative to location), side (defines which margin to place the text) and of course cex (size), col (color)… Note that you may use locator(1) as an argument to locate the place of your text. When entering locator(1), R allows you to point at the location on the chart with your mouse! Quite practical indeed… Otherwise you may type in the coordinates (X,Y) of the place to use. pos and side are used for text() and mtext() respectively to indicate where the text should be displayed relative to the coordinates (valid for text()) or in which margin (valid for mtext()). Use 1, 2, 3 and 4 for bottom, left, top and right, respectively.
[code language=”r”]
plot(z~x)
text(locator(1), "Something to read", pos=4)
mtext("Something else to read", side=1, line=2)
[/code]
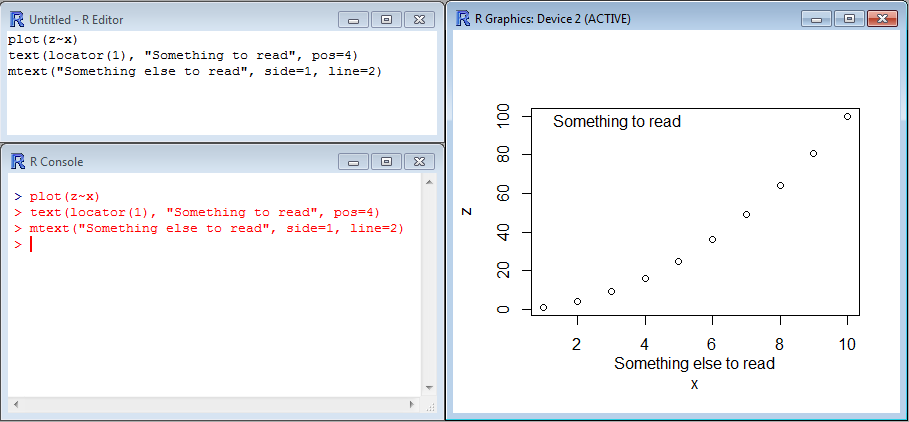
Once that the code has been entered in the script window and executed (via CTRL+R), the mouse pointer turns into a cross which you may use to indicate where to write “Something to read”. When you click, “Something to read” is printed and the rest of the code is executed.
Note the argument line= in mtext(): this is used to lower the text “Something else to read” by 2 lines. Without this extra parameter, the text would have appeared just under the X-axis, thus overlapping with the ticks.