
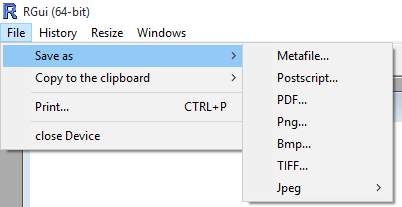
Once you’ve done your magic, you may be interested in keeping a memory of your masterpiece. This is where the Save as menu becomes useful. Note that the graphic window (the one containing your graph) must be active when saving; if you aren’t sure about it, click once on the graphic window to make it active and then go to File and choose Save as. In the menu that shows up, several options are available: Metafile, Postscript, PDF, Png, Bmp, TIFF and Jpeg. Of course, each of these options has a different outcome. Some file types (TIFF for instance) preserve quality but make a large file (useful for high quality prints needed for posters, articles…), some others (Jpeg) make a small file (useful for publishing on the Web) but decrease the quality, some contain additional data useful for post-processing of the chart… Make sure that you choose a file type adapted to your project.
If you choose Copy to the clipboard, two options come up: either as a Bitmap or as a Metafile. In both cases, no file will be created but the “picture” of the graph will be placed in the temporary memory of the operating system. The next move is to open any program such as MS Word, Paint, Adobe Photoshop… and paste the content of your clipboard in it using CTRL+V.
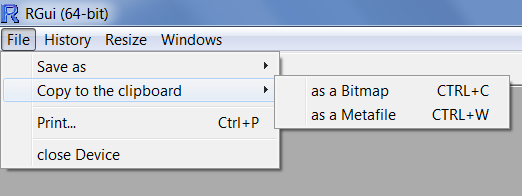
Choosing Copy to the clipboard > as a Bitmap stores a snapshot of the graph in memory, but this snapshot is of limited resolution. Zooming slightly on the pasted picture quickly reveals pixels… and might not look nice on a report or in an article. Choosing Copy to the clipboard > as a Metafile stores an advanced picture of the graph in memory. This advanced picture is a vector graphic image that keeps high resolution and details, even when zooming in the picture. This option is recommended when pasting in MS Word.
You may choose to use code to save your graph into a file. In that case, depending on whether your output file is a jpeg, png, pdf or metafile, you will use the following functions in respective order: jpeg(), png(), pdf() and win.metafile(). Between the parentheses, you just need to write the file name with the correct extension. Note that these functions have to be written prior to coding for the graph. Finally, the whole process must be terminated with the command dev.off().
Here is an example for saving as a metafile. The file will be created at the root of the D: drive of your machine, and will be called filename.wmf.
[code language=”r”]
win.metafile("d:/filename.wmf")
plot(z~y)
dev.off()
[/code]
And here is an example for saving as a png. The file will be created at the root of the D: drive of your machine, and will be called filename.png.
[code language=”r”]
png("d:/filename.png")
plot(z~y)
dev.off()
[/code]