
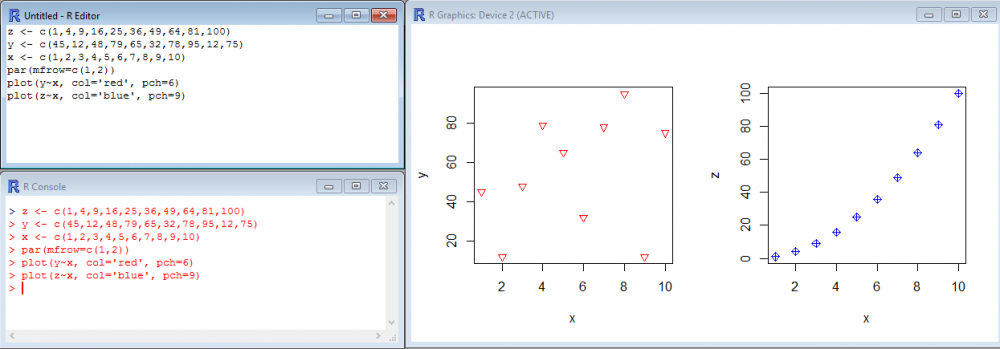
A simple function allows you to display multiple charts side-by-side. It can be charts of the same type or of many different sorts; it can be just plots next to each other (lines) or many plots aligned in rows and columns (matrices). That function is called par(mfrow=c(X,Y)) where X is the number of rows available for displaying the plots, and Y the number of columns. It basically gives R an indication of the layout of your group of charts. Once entered, simply add the commands to create the plots one by one. Here, we display two plots next to each other (1 row, 2 columns):
[code language=”r”]
z <- c(1,4,9,16,25,36,49,64,81,100)
y <- c(45,12,48,79,65,32,78,95,12,75)
x <- c(1,2,3,4,5,6,7,8,9,10)
par(mfrow=c(1,2))
plot(y~x, col=’red’, pch=6)
plot(z~x, col=’blue’, pch=9)
[/code]
Note that this function gives a layout where the different charts in your combination will have similar dimensions. If you wish to make a combination of charts where their dimensions are not necessarily identical, you may try layout().