
 To draw a boxplot, select your range of data, then go to the tab
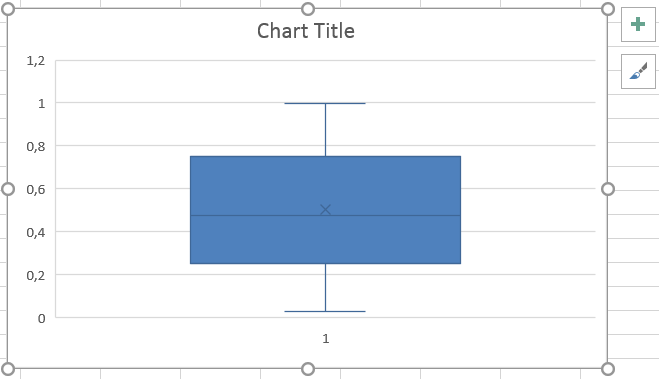
 Insert, find the icon Insert Column or Bar Chart and select More Column Charts... In the long list of charts in the tab All Charts, click on Box & Whisker and OK. The following chart appears.
As you can see, the chart is pretty much ready to use. Right-clicking on the box and choosing Format Data Series..., you will be able to decide via the menu to the right whether outliers, data points, etc are to be displayed.
Fant du det du lette etter? Did you find this helpful?
[Average: 0]