
It is of course possible to show more than one series in a bar graph. This is especially easy and useful when the data series to visualize are organized according to the same categories or labels.
Let's come back to our previous example. In the original table, the precipitations for 2016, 2017 and 2018 were recorded every month. We thus have 12 categories (jan, feb, mar...) which are common to each recorded year. This makes it possible to create a clustered graph in which the data from January 2016, January 2017 and January 2018 will be grouped, and so on for the others months. Let's create this chart.
 We start in the same manner as we did previously for the graph with single data series. In the
 Charts section of the Insert ribbon, click the icon Insert Column or Bar Chart and choose the type of chart you would like to use (here we use the one at the top left corner of the menu Clustered Column).
 A blank chart appears. Right-click in it and click
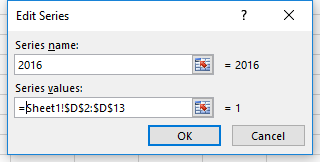
 Select Data.... In the new dialog box called Select Data Source, click Add under Legend Entries (Series). The next box helps you define your data series. Under Series name, type in "2016". Under Series values, select the range of data to display (D2:D13). Finish by clicking OK.
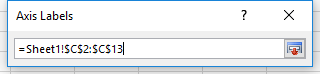 To set the month under each bar, we go back to the dialog box
 Select Data Sourceand click on Edit under Horizontal (Category) Axis Labels. The new dialog box allows to set the range of cells that contains the labels. Here we use C2:C13 and click OK.
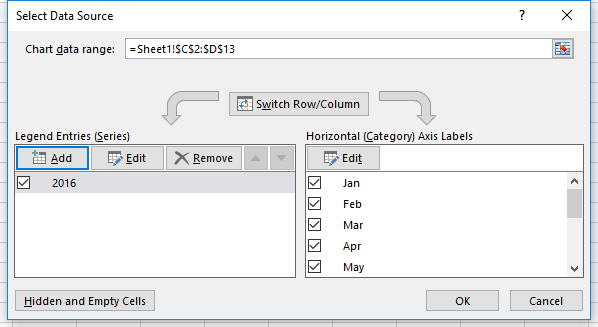 We come back to the
 Select Data Source. Let's create new data series for 2017 and 2018. Click on Add to add a new data series corresponding to 2017.
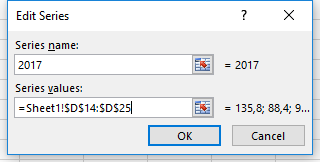 In the
 Edit Series box, indicate 2017 under Series name and select the range D14:D25 under Series values. Press OK to validate. Proceed in the same way for the 2018 data.
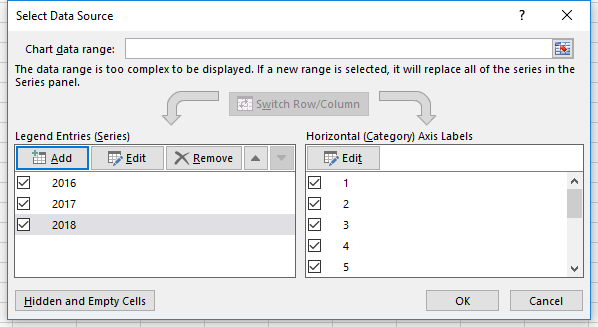 After validating with
 OK, the Select Data Source box should include 3 data series. Click OKonce more to validate.
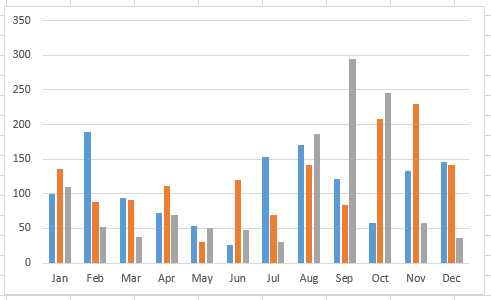 The graph now shows all three data series organized by month, making it easy to compare precipitations at the same time of the year in 2016, 2017 and 2018.