
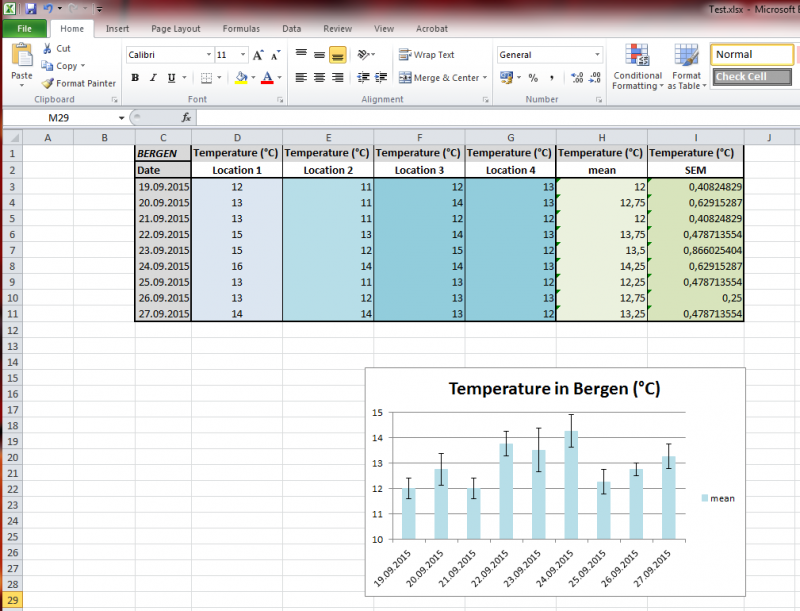
To understand how to export tables, let’s work on the following example:
Most of what has been explained previously regarding charts is actually applicable to tables. Again you will find out that there is a possibility to import an MS Excel table into MS Word (or others) as a picture, as a linked table, as a table with embedded data, and as pure text.
 Let’s first select the table in MS Excel: as usual, use the mouse to select the table or range of cells and either right-click on the selection to display the contextual menu and select
 Copy, or press CTRL+C. Then, in MS Word or Powerpoint, right-click anywhere on the blank page/slide (or any open document) and select one of the Paste Options (see picture to the right). Again, the icon that you will select will define which format will be used to paste your table and what you will be able to do with this object.
1. The “embedded” table
![]() The first two icons have in common that they allow you to paste an embedded table. This table is editable independently of MS Excel. Changes to the original file won’t affect the table in MS Word and changes to the table in MS Word won’t affect the original data. While the first icon keeps formatting as it was in MS Excel (with colors, size of the table, …), the second removes all forms of formatting to adapt the table to the local formatting in use in the MS Word document.
The first two icons have in common that they allow you to paste an embedded table. This table is editable independently of MS Excel. Changes to the original file won’t affect the table in MS Word and changes to the table in MS Word won’t affect the original data. While the first icon keeps formatting as it was in MS Excel (with colors, size of the table, …), the second removes all forms of formatting to adapt the table to the local formatting in use in the MS Word document.
2. The “linked” table
![]() The third and fourth icons have in common that they allow you to paste a linked table. This table refers constantly to the original datasheet. Any change made to the MS Excel worksheet has consequences for the table in MS Word; if changes are not immediately visible, the
The third and fourth icons have in common that they allow you to paste a linked table. This table refers constantly to the original datasheet. Any change made to the MS Excel worksheet has consequences for the table in MS Word; if changes are not immediately visible, the Update Link option in the contextual menu of the table (accessible with the right-click) will synchronize the table between MS Excel and MS Word and provide the final corrections. Note that changes in MS Word do not appear to affect the original MS Excel worksheet. Again, whereas the third icon keeps the original formatting, the fourth converts the table to fit the destination theme.
3. The snapshot
![]() The
The Picture icon makes a copy of your table and converts it into a picture. There is nothing that can be tuned or modified, excepted the size of that picture.
4. The raw text
![]() The last icon keeps only the text (labels, parameters and numerical data) and removes nearly everything else. The table itself is removed; colors, gridlines and other forms of formatting are gone. The only thing that remains beside the text is the approximate organization of the table in terms of spacing, columns and rows. However, vertical alignments do not necessarily reflect the original worksheet.
The last icon keeps only the text (labels, parameters and numerical data) and removes nearly everything else. The table itself is removed; colors, gridlines and other forms of formatting are gone. The only thing that remains beside the text is the approximate organization of the table in terms of spacing, columns and rows. However, vertical alignments do not necessarily reflect the original worksheet.
5. So which one should I use?