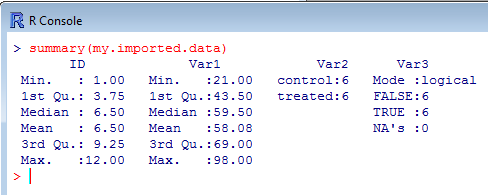
From here, you can use summary() to get a quick overview of your imported dataframe. summary() offers a reduced, but in fact very informative list of descriptive statistics for each numerical variable, including mean, median, quartiles and minimum/maximum. As for the text and logical variables, a count of each level of categorical variable is provided.
[code language=”r”]
summary(my.imported.data)
[/code]

You notice also that summary() has calculated the mean, median and so on for the variable ID, which is in fact the ID number that we gave to each observation. summary() did not make a distinction here and processed the whole table. Note however that R gives an ID or row number anyway to each of the observation as you will see further in the section “Sorting data in a dataframe“
Another function gives you information about the structure and modes of your dataframe. This function is called str() and takes as an argument the name of the dataframe: str(object.name).
[code language=”r”]
str(my.imported.data)
[/code]

Variable by variable, the mode (integer, logical, factor) and an incomplete overview of the content of the dataframe are displayed. The fact that str() gives details about the names and levels of the factors in Var2 is useful as you may quickly spot problems or mistakes. Indeed if one of your data elements has been incorrectly entered (for example, cntrl instead of control), it may be quickly spotted here as the number of levels will be higher than expected and the faulty variable will be revealed.
You may use dim() to print the number of rows and columns in the dataframe.
[code language=”r”]
dim(my.imported.data)
[/code]

