The function rnorm() generates automatically a series of random values which are normally distributed. This comes quite handy when you want to test functions, statistical analyses or scripts on a random dataset, and you need to be sure that the content is normally distributed beforehand.
rnorm() needs the following information:
- n, the number of values needed,
- mean, the mean of the values to be generated,
- sd, the standard deviation of the data set
The syntax is as follows:
[code language=”r”]
rnorm(n, mean, sd)
[/code]
Here is an example where we want to generate a series (called random.set) of 200 values, which mean is 42 and which standard deviation is 8:
[code language=”r”]
random.set <- rnorm(200, 42, 8)
[/code]
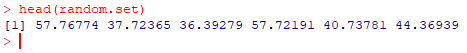
And the first values in the data set look like this:
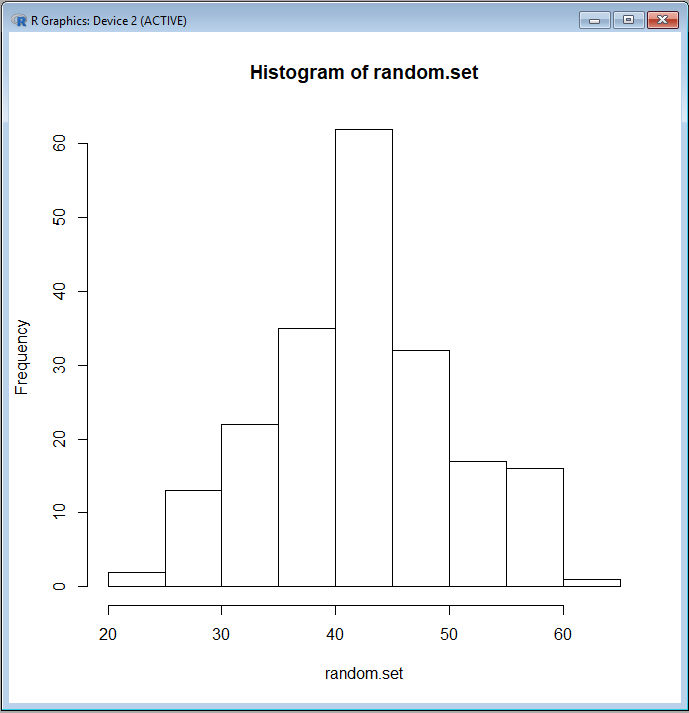
This is what you get if you plot the data set with hist()
[code language=”r”]
hist(random.set)
[/code]
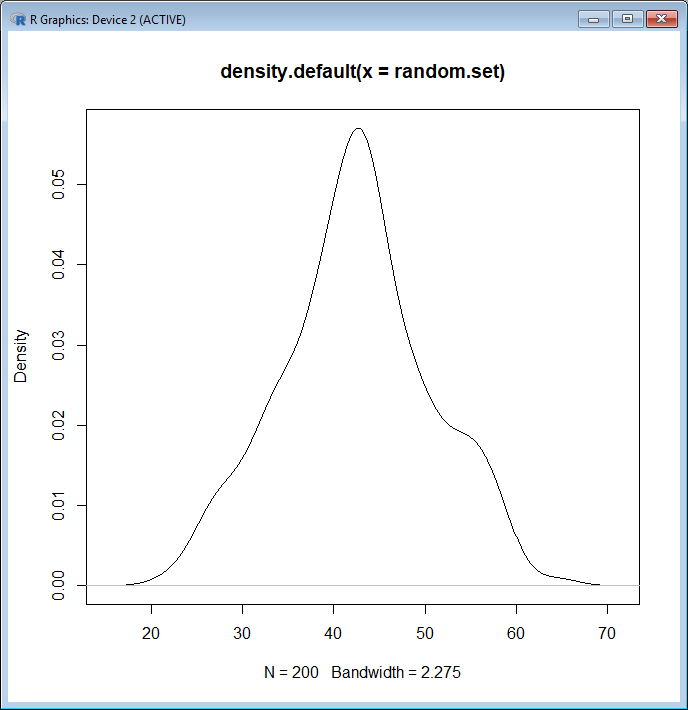
A density plot with plot(density()) can also be useful to visualize the distribution:
[code language=”r”]
plot(density(random.set))
[/code]