
Text and symbol size are highly tunable. Here are a series of commands based on the argument cex and its many variations. In all cases, you will have to use a value X which is a magnification factor by which the original size of the object will be multiplied. If X = 1.5 the size will be increased by 50%; if X = 0.5 the size will be reduced by 50%.
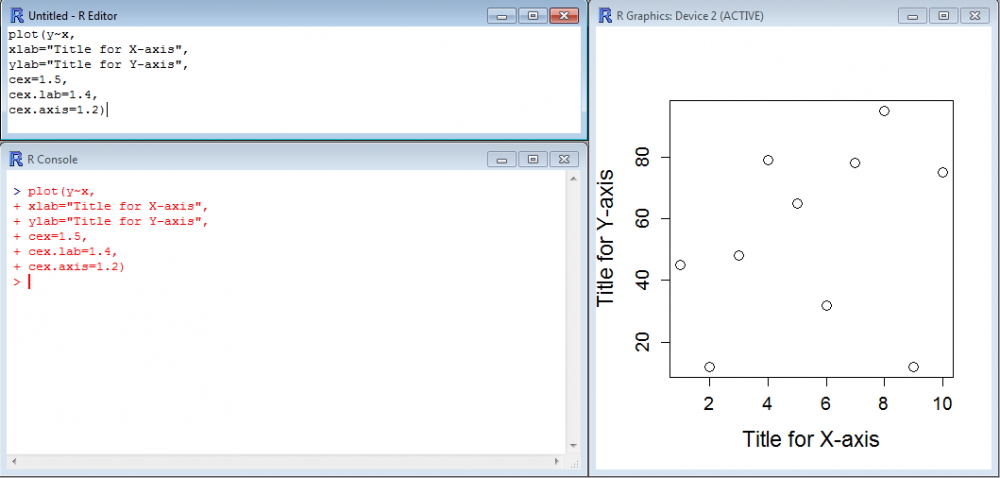
cex=X allows you to increase/decrease the size of the symbols in the plot,cex.lab=X modifies the size of the labels,cex.main=X modifies the size of the titles,cex.sub=X modifies the size of subtitles,cex.axis=X tunes the size of the axis annotations.Here is an example (note that the parameters can be added one after each other, separated by a comma):
[code language=”r”]
plot(y~x,
xlab="Title for X-axis",
ylab="Title for Y-axis",
cex=1.5,
cex.lab=1.4,
cex.axis=1.2)
[/code]
Fant du det du lette etter? Did you find this helpful?
[Average: 5]