
It is fairly easy to build a dataframe from scratch in R. All you need is a series of vectors and/or series containing your data and a good recipe! And very often, a good recipe is a simple one…
First you have to decide how many columns this dataframe will have, and what will their content be. Then, you need to create a vector for each column and give it a name. You must be clear about which of these vectors are factors and define them as such with the function factor(). Finally, you store these vectors in the new dataframe using the function data.frame().
NB: this recipe has been employed several times in the chapter ANOVA to create the dataframes used as example.
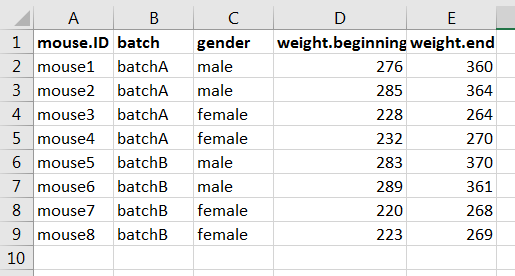
Let’s take an example: we want to build a dataframe storing data about 8 mice, 4 from a batch called “batchA” and 4 from “batchB”. There are 2 males and 2 females in each batch. The response data stored in the dataset in their weight as measured at both the beginning and the end of an experiment. Finally, these mice have “names” and these names are “mouse1”, “mouse2”, …, “mouse8”.
Step 1: define the names of the variables
Let’s make the column names clear from the beginning. We’ll have 5 columns:
mouse.ID: the names of the individuals (“mouse1”, “mouse2”, …, “mouse8”),batch: the batch from which these individuals come (“batchA”, “batchB”),gender: the gender of the individual (“male”, “female”)weight.beginning: the weight of the individual as recorded at the beginning of the experiment,weight.end: the weight of the individual as recorded at the end of the experiment.
Out of these 5 columns, 2 correspond to response variables: weight.beginning and weight.end. 2 columns correspond to factors: batch and gender. The remaining column will simply contain the ID of the individual. Finally, we decide that the order of the columns is as follows: mouse.ID, batch, gender, weight.beginning, weight.end.
This is how the dataset look like in MS Excel, with the data:
Step 2: prepare the vectors
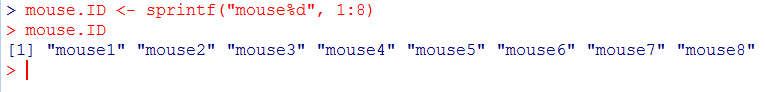
The vector mouse.ID contains the entries with “mouse” directly followed by a number ranging from 1 to 8. This can be simply coded in the following way:
[code language=”r”]
mouse.ID <- sprintf("mouse%d", 1:8)
mouse.ID
[/code]
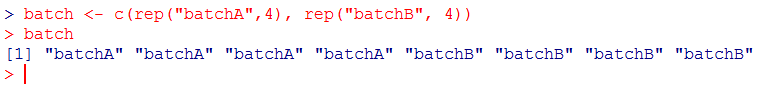
The vector batch contains the entries with “batch” directly followed by A or B. 4 instances of each can be coded with rep() which allows replication of strings:
[code language=”r”]
batch <- c(rep("batchA",4), rep("batchB", 4))
batch
[/code]
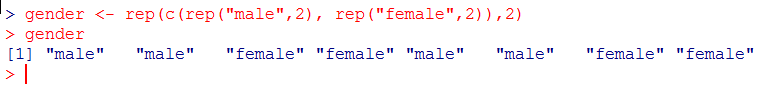
The vector gender containing the entries “male” and “female” is easily coded with the function rep() which allows replication of strings. Here, we ask R to put two “male” and two “female”, and to repeat that once more:
[code language=”r”]
gender <- rep(c(rep("male",2), rep("female",2)),2)
gender
[/code]
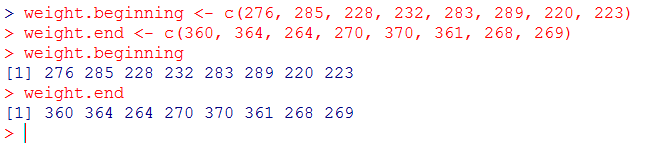
The vectors weight.beginning and weight.end containing the two response variables may be entered as simple numerical vectors, one for each variable:
[code language=”r”]
weight.beginning <- c(276, 285, 228, 232, 283, 289, 220, 223)
weight.end <- c(360, 364, 264, 270, 370, 361, 268, 269)
weight.beginning
weight.end
[/code]
At this point, we have all the vectors that we need. There is only one thing that we have to check before making the dataframe: that all vectors have the same number of items! If one of them is different, R will return an error message. To check this, use length(). length() return the number of items in the indicated vector:
[code language=”r”]
length(mouse.ID)
length(batch)
length(gender)
length(weight.beginning)
length(weight.end)
[/code]
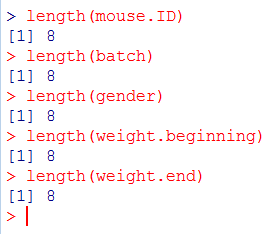
All are equal to 8. We are good to go.
Step 3: set the factors
This is not a mandatory step per se but it is good practice to do it anyway since it may avoid problems.
Both batch and gender are categorical variables and may as such be recorded in the dataframe as factors. As of now, they are just character vectors as shown by class():
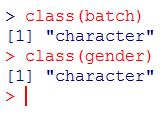
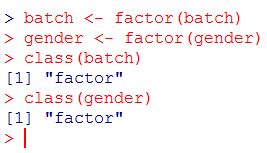
We thus have to use factor() to do convert them to factors, and we use class() to check that they have been converted properly:
[code language=”r”]
batch <- factor(batch)
gender <- factor(gender)
class(batch)
class(gender)
[/code]
Step 4: build the dataframe
Now it is time to build the dataframe. We’ll use the function data.frame() to assemble all vectors as columns automatically and store the whole dataset under the name my.experiment.df (it is good practice, but not mandatory, to write .df at the end of the vector to remember that it is a dataframe):
[code language=”r”]
my.experiment.df <- data.frame(mouse.ID, batch, gender ,weight.beginning, weight.end)
my.experiment.df
[/code]
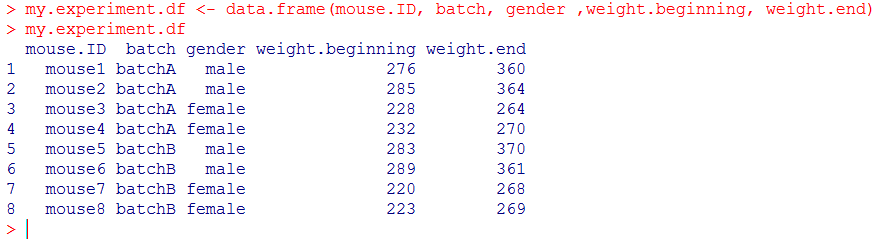
… and that’s it!
Step 5: check that everything is ok with a few simple functions
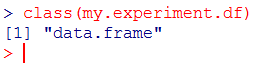
First, check that your dataframe my.experiment.df is indeed registered in R as a dataframe with class():
[code language=”r”]
class(my.experiment.df)
[/code]
Then check its structure with str():
[code language=”r”]
str(my.experiment.df)
[/code]
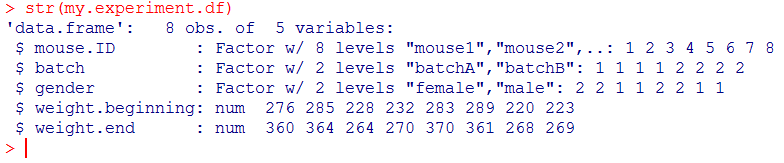
Note that the output tells you a lot here:
- the number of observations: 8
- the number of variables: 5
- the first 3 variables are factors with 8, 2 and 2 levels respectively
- the last 2 variables are numerical.
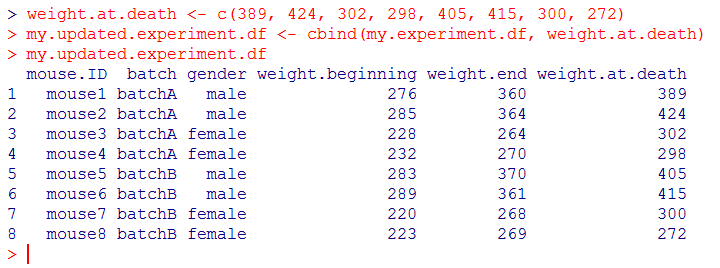
Ooops… need to add a column/variable?
The function cbind() allows you to add one more column to the dataframe. Create a vector for this column first, then add it to the existing dataframe and store it to a new dataframe.
[code language=”r”]
weight.at.death <- c(389, 424, 302, 298, 405, 415, 300, 272)
my.updated.experiment.df <- cbind(my.experiment.df, weight.at.death)
my.updated.experiment.df
[/code]
Ooops… need to add a row/observation?
The same is actually possible with rows. The function is rbind(). However the process is much more complex because the row to be added must contain the precise same names/types of variables than those in the target dataframe. You must then follow this procedure:
- create a new dataframe (called
new.row.df) that contains all the necessary variables and give the variables ofnew.row.dfthe names of the variables of the original dataframemy.updated.experiment.dfvia the functionsnames()which retrieves names andcolnames()which gives names: - add the new row to the existing dataframe using
rbind().
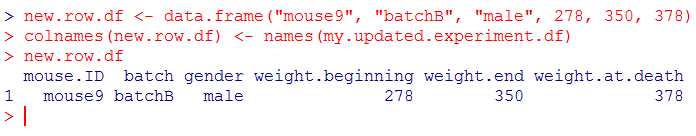
Here is the code for phase 1:
[code language=”r”]
new.row.df <- data.frame("mouse9", "batchB", "male", 278, 350, 378)
colnames(new.row.df) <- names(my.updated.experiment.df)
new.row.df
[/code]
… and for phase 2:
[code language=”r”]
my.reupdated.experiment.df <- rbind(my.updated.experiment.df, new.row.df)
my.reupdated.experiment.df
[/code]
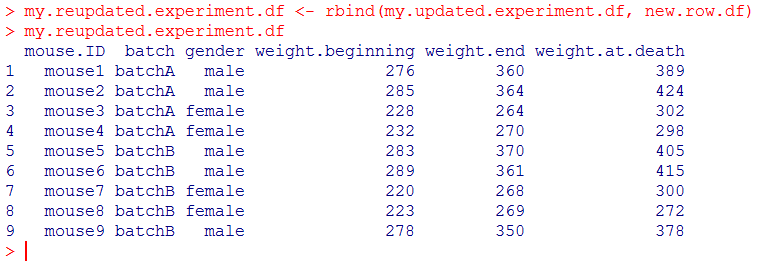
and indeed the last line contains the new observation, with all variables.