The default symbol for plotting data elements is an open circle, but you are not obliged to stick to this. The argument pch= (plotting character) allows you to choose the symbol from a list. Check in the list below which symbol you like best and indicate the corresponding number in the argument.

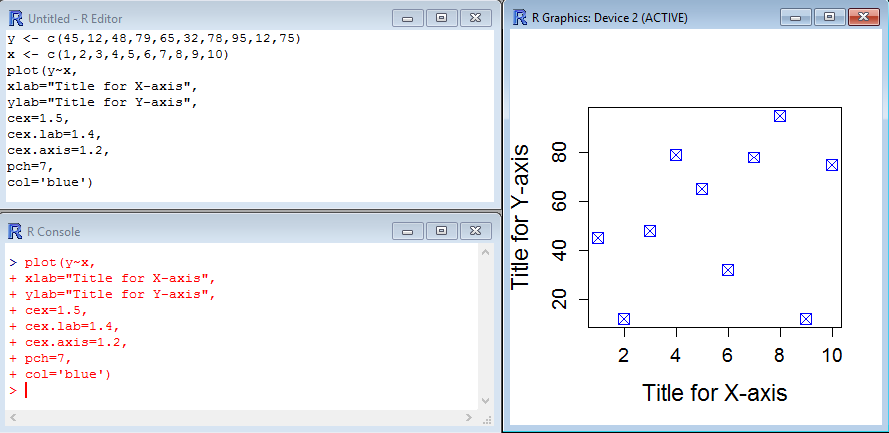
You may also play with colors and find the one that gives you satisfaction. Colors codes are found on this document and on this page. Use the argument col= to apply the color to the symbols. Here is an example where both symbol type and color are modified:
[code language=”r”]
y <- c(45,12,48,79,65,32,78,95,12,75)
x <- c(1,2,3,4,5,6,7,8,9,10)
plot(y~x,
xlab="Title for X-axis",
ylab="Title for Y-axis",
cex=1.5,
cex.lab=1.4,
cex.axis=1.2,
pch=7,
col=’blue’)
[/code]

Note that the function colours() displays an extensive list of color codes in the console.
