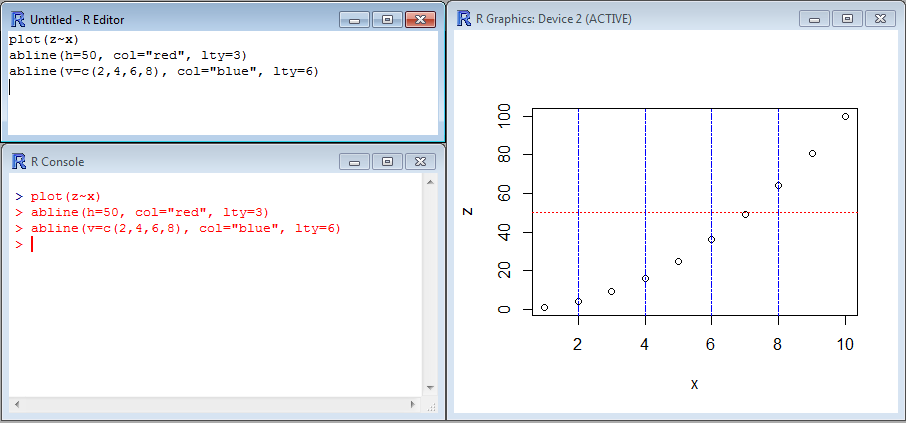
Reference lines are useful to visualize a threshold on a chart, or to represent or point at specific values such as mean and median. The function abline( ) draws such a line directly in your chart. abline() needs to know whether the line is horizontal (h=) or vertical (v=) and where to place the line (using the Y or X data as coordinate). You may add arguments to change colors (col=), line type (lty) and width (lwd). You can even add several lines at once using concatenate c(). In the following example, 4 vertical lines (X=2,4,6,8) and 1 horizontal line (Y=50) are added to the plot:
[code language=”r”]
plot(z~x)
abline(h=50, col="red", lty=3)
abline(v=c(2,4,6,8), col="blue", lty=6)
[/code]

Fant du det du lette etter? Did you find this helpful?
[Average: 0]
