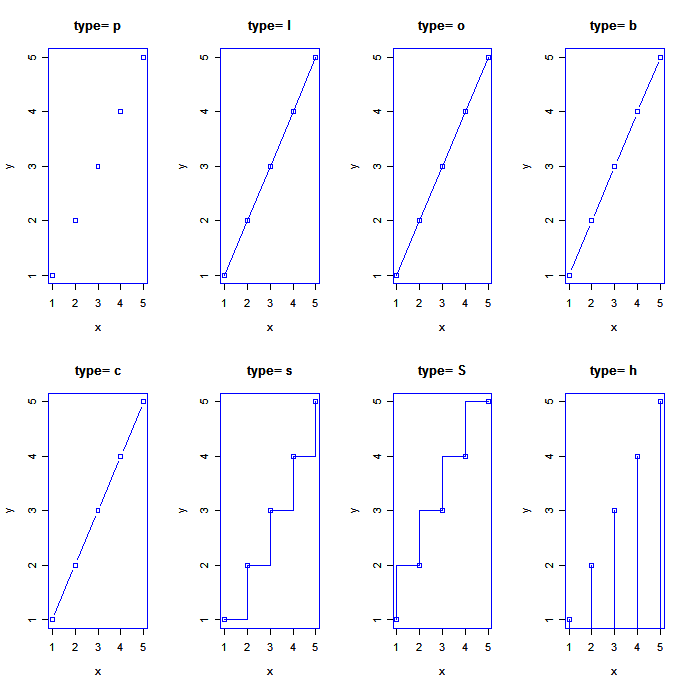
The function lines() draws a line connecting the symbols on the chart. It does not produce a line chart by itself, nor does it build the axes… but it only adds lines to an existing plot. The main parameter in lines() is type= and the options for using type= are the following:
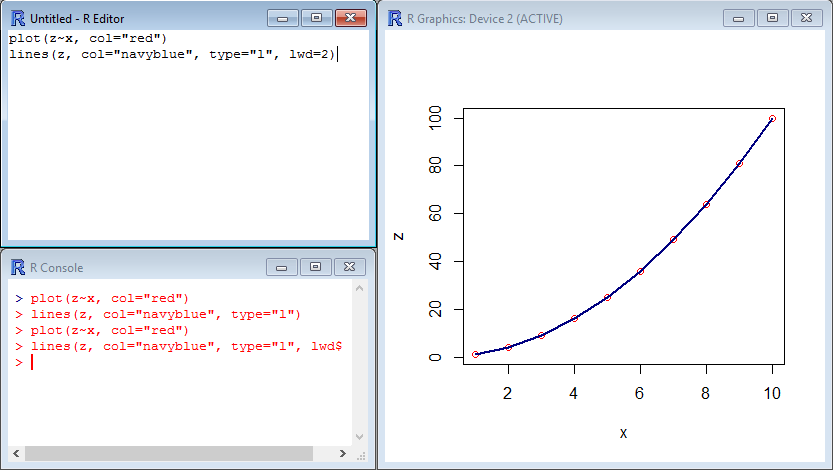
In the following example, lines(z, col="navyblue", type="l", lwd=2) is used to join the dots of the plot(z~x) chart with a thick blue line:
[code language=”r”]
plot(z~x, col="red")
lines(z, col="navyblue", type="l", lwd=2)
[/code]
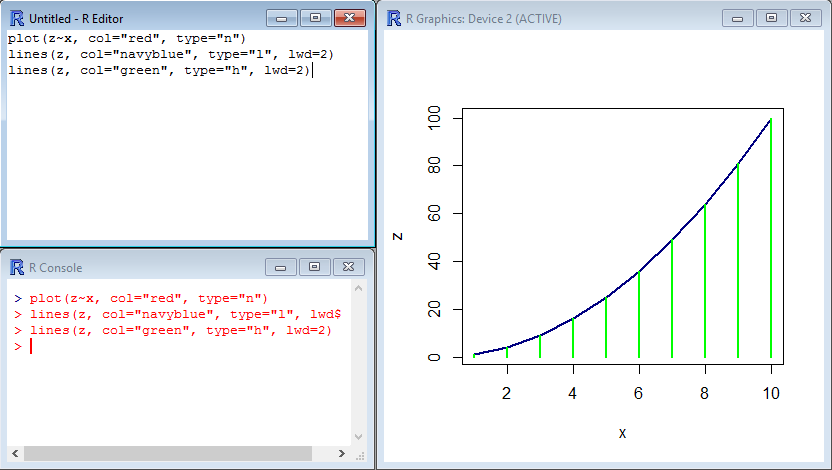
You may also add several lines to the same chart if you wish so… however, some of the options for type= are incompatible with the default display of plot(). Indeed, plot() draws symbols which you may not want to see when using lines(type=l); if you want to see the symbols disappear, use type="n" (which disables plotting of symbols) in the function plot() itself.
[code language=”r”]
plot(z~x, col="red", type="n")
lines(z, col="navyblue", type="l", lwd=2)
lines(z, col="green", type="h", lwd=2)
[/code]