Authors: Erling Boge, Erlend Mjelde Hanssen, Håvard Kaland, Jenny Neuhaus & Leah Strople.
Introduction
Acoustic surveys have several important roles in stock assessment, giving estimates on local abundance and concentration of fish and plankton species in the water column (Koslow, 2009). Given the depth and decibel (dB) values for certain species, they can be localized and tracked. Combined with active sampling, one can derive more accurate population estimates, especially for fish species. The detection of species depends on different frequencies. Usually, either 18, 28, 120 or 200 kHz is used. For higher frequencies, the depth range is shorter and the detection rate for smaller organisms increases. Lower frequencies have a greater depth range and are used for the detection of larger organisms. As a point of reference, a young and healthy person can detect frequencies from about 20–20000 kHz (Cutnell and Johnson, 1998).
After acoustic measurements are taken, they need to be scrutinized in "Large Scale Survey System" software (LSSS) in order to extract information about species abundance. The objective of this tutorial is to show the technical skills necessary to scrutinize acoustic data in LSSS and extract this information.
For your work, you will open an already generated survey. This survey was made by instrument personnel on board, and the details of this will be given during the cruise and are not something you will need to complete as a student.
This tutorial is divided in 2 parts:
1. How to scrutinize acoustic data
Here you can see the 3 acoustic surveys we conducted on our cruise (red squares). The illustrations used in this protocol are extracted from these survey areas.
Click the 5nmi-button in the menu bar to view the transect in manageable sections of 5 nautical miles.
Click within the window to get the integration line drawn by the program. The integration line should be a thin, black, diagonal line.
In this example you can see a sharp vertical incline of the integration line. This is due to the CTD reading, illustrated in blue in the top row. The CTD was lowered while the acoustic readings were undertaken.
The integration line includes any noise produced at the surface, such as lowering the CTD and the creation of bubbles. To avoid these false measurements to be included, the integration line should be straightened out prior to any scrutinizing of the real acoustic data.
To fix the integration line, select the pencil tool and draw the red surface line slightly down under the CTD icon.
Adjust the depth within the main menu to get the most suitable view of your data. You should select a depth slightly below the bottom.
How to distinguish the bottom: the bottom layer is displayed as a thick red line. Below, a bouncing echo is shown in green-blue, ignore this layer when adjusting the depth.
After you have pressed the + symbol, one of the following line options will occur on your screen. Using the space bar on your keyboard, you can select different line options (school box, horizontal line, vertical line, and cursor).
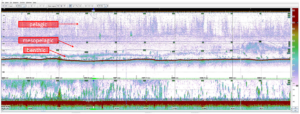
Now, you are supposed to choose one layer for benthic, mesopelagic and epipelagic organisms. You decide this by studying the different echo layers and their strengths (you will learn more about this during the cruise). Start choosing the benthic layer by clicking above the majority of the demersal fish with the horizontal line tool. Repeat this action for the mesopelagic and planktonic layer.
Switch from horizontal line to move lines tool using the space bar on your keyboard. Now, you want the benthic layer line to have the same shape as the bottom topography. Drag the straight bottom line you just created down to the actual bottom line, using the move lines tool, and up again to the approximate same position as you had decided on for the benthic layer.
Use the pencil tool to draw lines to include large schools that may cross water column layers, as shown here.
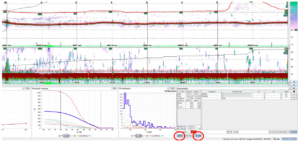
Click inside the benthic layer. Now, increase the decibel (dB) scale on the right of the page, until the plankton is removed and only fish remains. This is a simplified explanation and you will get more information on how to decide how much to increase the dB on the cruise. For now, we will show a standard increase to -65 dB. By adjusting the dB scale, you can observe how the echo layer in your transect changes.
While the benthic layer is still selected and the dB is increased to -65, select BUNN and PLANK on the bottom row on the screen.
Extract the SA value for the benthic layer from the table and note it on a sheet of paper (in this case it is 480).
Click the -82 button at the bottom of the decibel bar to reset it to the standard of -82 dB. Now, select the Rest button in the PLANK column as shown here.
Under SA BUNN, fill in the SA value from your sheet and press enter. You will now get the percentage of demersal fish (BUNN) and plankton (PLANK).
Repeat the protocol for the mesopelagic and the epipelagic layer from this step. Remember to click inside the layer you are working with before adjusting the dB scale to -65. Instead of selecting BUNN, select MESFI and PLANK, and PELAG and PLANK for the mesopelagic and the epipelagic layer, respectively.
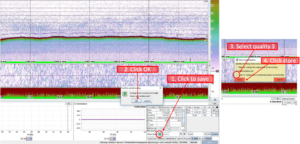
Now you have scrutinized 5 nautical miles of acoustic data. To save it, press the store (nmi): 1 button. Now you will see a little box with header confirm partial storing. Press OK. Next, another small box appears. Here, the quality of your scrutinizing, based on the information used, is assessed. For your work, press Low (3: categories completely mixed acoustically) and store. The screen will turn green and your section has been saved.
The next section of 5 nm is ready to be scrutinized. Follow the protocol from the beginning. Scrutinize all sections included in your survey area chosen in the beginning (red boxes on map).
2. Creating List Use Files (LUF)
After someone has scrutinized a survey, you can export the data as a list use file (LUF). By using LUF, you can look at the files as biological data. There is no need to do the acoustics and have knowledge about it. Many researchers make use of these files.
The most standard files are LUF 3 and LUF 16. LUF 16 gives higher resolution and includes vertical resolution that can be used for e.g predator-prey relationships.
To store the file as LUF:
a. Go to File, press DB generate report.
b. Press on Check to print at reduced resolution. Accumulate distance (nmi) and write 1 in the box.
c. At the bottom of the window, select 3 and 16, and press generate. A LUF 3 and LUF 16 text file will be generated.
d. At the top of the window Reports directory gives you information about where the file is stored.
e. Open the file with a text editing program as “TextEdit” on mac or “Notepad” on windows.
f. You can import this .txt file into Excel using the file-import function within Excel. However, be mindful of what delimitator is being used within the text file ( eg. “;” or “tab”) to ensure proper import.
In summary
This protocol will hopefully guide you to scrutinize your first survey. The acoustic measurements together with catch data can give good estimations of species composition and abundance at different depths and echo layers. The generated LUF files makes it possible for researchers to look at the biological data without doing the scrutinizing.
References
Cutnell, J.D. and Johnson, K.W. 1998. Physics. 4th ed. New York: Wiley.
Koslow, J. A. 2009. The role of acoustics in ecosystem-based fishery management. ICES Journal of Marine Science. 66: 966-973.
Castellote M., Mooney T.A., Quakenbush L., Hobbs, R., Goertz, C., Gaglione, E. 2014. Baseline hearing abilities and variability in wild beluga whales (Delphinapterus leucas). The Journal of Experimental Biology. 217:1682-1691.


