Examples in biology courses


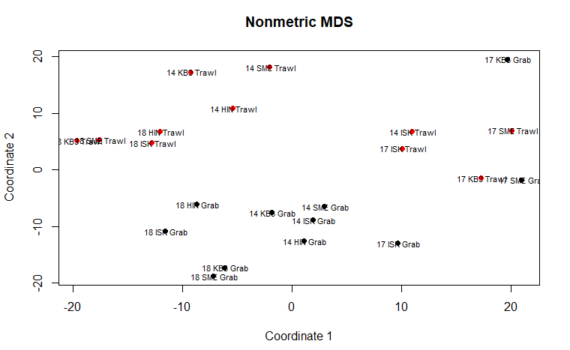
We can perform many methods to visualize and analyze multivarate data. In the tutorial you can find scripts and a short description to 3 of the most commonly used ones: Cluster analysis Multi dimensional scaling (MDS) PCR/RDA In this post, we will look at Principal Component Analysis (PCR) and RDA. […]

5.5 Multivariate analysis – PCA/RDA


Below, you will find some examples of plots and scripts that are relevant for some of your projects. There is also an own section on ggplot in bioSTATS, and at the ggplot web-page.   Example 1: Polar cod contribution to fish community For the plots below you will need the […]

6.3 Example scripts for some plots


[code language=”r”] ##### inspect data #### #inspect summary stats summary(Data_in2) #max, min,median, mean summary(Data_in) #max, min,median, mean range(B_taxa) #max & min values in whole dataset range(Data_in) #you will get an error message: this only works if the dataframe contains only numeric values #The amount of 0s in your dataset can […]

5.1 Example script (Inspect & standardize/transform data)


Introduction on many basics are covered other places in the R-tutorial. I encourage you to look around there if you need help with basic operations.  Still, below I mention some basics that you will need. Creating objects R treats our data as objects. They can be single vectors, matrices, lists […]

4.2 Some basics


[code language=”r”]#set working directory setwd("C:/Users/x/OneDrive/AB202 vår 2019/R") ################ import data and preparations ##### # for data import, make sure that the file path is correct #import from text file (export as text from excel file first, tabulator deliniated)### Data_in<-read.table("C:/Users/x/OneDrive/AB202 vår 2019/R/AB202fish_poster.txt", header=TRUE, sep="\t", dec=",") Data_in<-read.table("C:/Users/x/OneDrive/AB202 vår 2019/R/AB202benthos_poster.txt", header=TRUE, sep="\t", dec=",") […]

3.5 Example script


Man kan beregne standardavviket ved bruke ett av de følgende alternativene: 1) Standardavviket er faktisk kvadratroten av varians. I Excel kan du derfor skrive inn: =ROT(VARIANS(...)). Eksempel: =ROT(VARIANS(A1:A100)).   2) Bruk funksjonen =STDAV.S(...) eller =STDAV.P(...) for å beregne standardavviket til henholdsvis et utvalg av populasjonen (sample), eller hele populasjonen.   […]

Hvordan beregne standardavvik


 Presenteres av: Marius Rydningen Saltvedt   Diauxi er en mekanisme for regulering av enzymsyntese som kalles katabolitt represjon. Det viser seg at syntesen av forskjellige (uavhengige) katabolske enzymer er hemmet når en mikroorganisme utnytter (vokser på) en bestemt energikilde, som f.eks. glukose. Dersom vekstmediet i tillegg til glukose også […]

Mikrobiologi – Diauxi Forsøk