
group_by() is a function that groups the cases (rows) of the table according to the different factors of a chosen categorical variable. When used alone, it transforms a data frame into a new table where the factors of the chosen variable are registered as grouped. The output table is then very similar to the original dataframe. When used in combination with a second function in a pipe (read about pipes here), group_by() splits the data frame by factor, applies the second function to each of the corresponding groups, and finally reassembles the data into a new table.
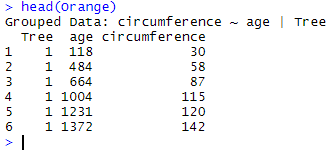
Let’s use the data frame Orange as an example. The top of the data frame looks like this:
head(Orange)
Here, for example, we group Orange by age and store the result in the object Orange_grouped_by_age:
Orange_grouped_by_age <- Orange %>% group_by(age)
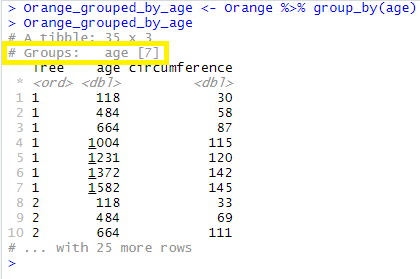
As you see above here, the data look unchanged, but R says that there exist 7 groups for the variable age (yellow box).
If we then decide to calculate the mean of circumference for each factor of age, we may do so by applying summarise(mean(circumference)) directly on Orange_grouped_by_age:
Orange_grouped_by_age %>%
  summarise(mean(circumference))
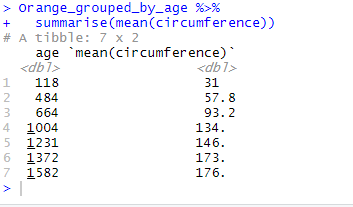
We thus obtain a new table where the 7 rows show the mean of circumference for each factor of age.
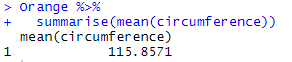
For comparison, this is what the same code does when applied to Orange (the original data frame without grouping):
Orange %>%
  summarise(mean(circumference))
Note that grouping is reversible, and that you may ungroup data in a table by using the function ungroup(). In our example, simply type:
ungroup(Orange_grouped_by_age)
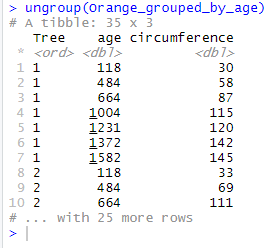
As you may see, the line that used to show the groups is now gone.