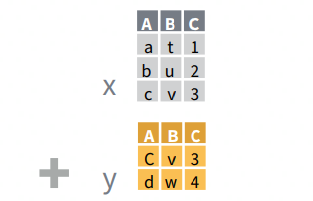
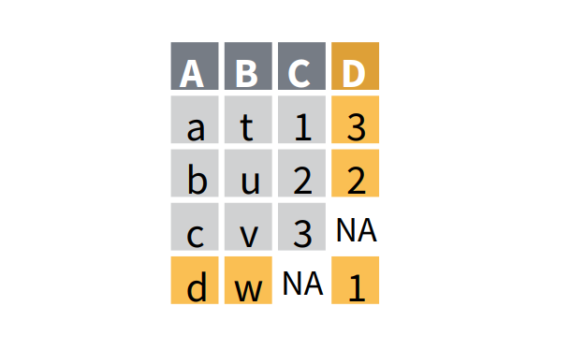
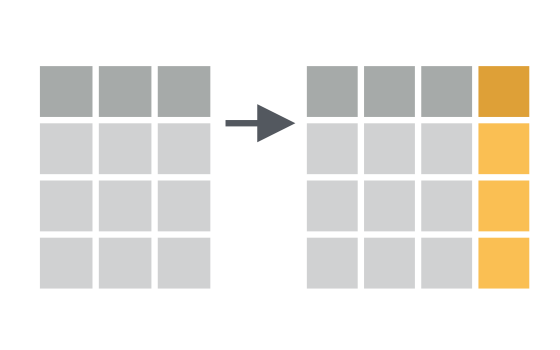
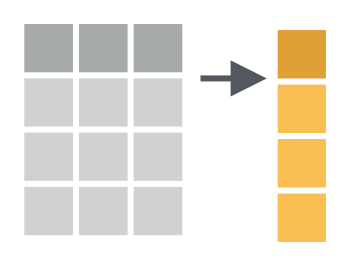
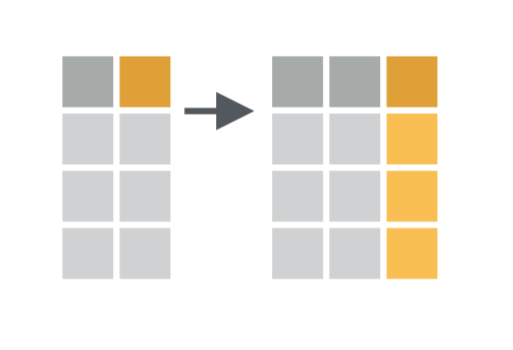
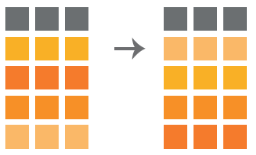
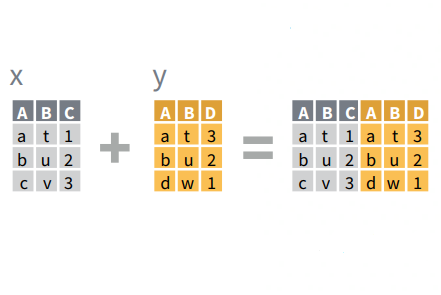
Data Transformation with dplyr


The function summarize() (which may also be written summarise()) creates a table in which you will find the result(s) of the summary function(s) you have chosen to apply to a data frame. The summary functions may be: mean(): which returns the mean of a variable, sd(): which returns the standard […]

Summarize Cases


group_by() is a function that groups the cases (rows) of the table according to the different factors of a chosen categorical variable. When used alone, it transforms a data frame into a new table where the factors of the chosen variable are registered as grouped. The output table is then […]

Group Cases


Count() does exactly what it says: it counts the number of cases! Applied directly to a data frame, count() will provide you with the number n of cases. Applied to a table which has been pre-grouped with group_by() (read more about group_by() here) or in a pipe in combination with […]

Count Cases


dplyr has a handful of functions that allow for cleaning a data set by selecting a specific subset of observations. Here are the functions we will look at here: filter(): extract rows that meet logical criteria slice(): extract rows by position top_n: extract the rows containing the n highest/lowest values […]

Extract Cases


The dplyr function arrange() allows for reordering data frames and tables based on the content of one or more variables. The function is quite simple and sorts all variables in ascending order by default. Here is an example where the variable age is sorted: Orange %>% arrange(age)   To sort […]

Arrange Cases


The dplyr function add_case() allows for adding cases to an existing data set, whether at the end of the set or a predefined place of the table. Note that there exist a function called add_row() which does exactly the same as add_case(). The syntax is simple. Between the parentheses of […]

Make New Cases


There are often situations where you need to update a data frame with additional cases, to merge different chronological versions of a data frame, to find out whether you have similar entries in two data frames,… in other words, situations where you need to identify and compare rows in two […]

Import Cases


Working with large data sets may be time-consuming or demanding in terms of computer resources due to high number of variables combined with high numbers of observations. Moreover, displaying a table/data frame with many variables in R/Rstudio isn’t very practical and you may soon want to reduce the data set […]

Extract Variables


dplyr and tidyverse (a larger package which includes dplyr) give the possibility to add columns (and thus variables) to an existing data frame. You may either add a new column from new data (usually based on the content of a vector, the content of another table or data frame, or […]

Make New Variables


dplyr and tidyverse (a larger package which includes dplyr) give the possibility to add columns (and thus variables) to an existing data frame. You may either add a new column from new data (usually based on the content of a vector, the content of another table or data frame, or […]

Compute Variables


A couple of variants of the functions mutate() and transmute() which are described here allow for modifying the content of a selection of variable(s). This means that, instead of adding new columns with the results of a given transformation/operation, the contents of the original variables are replaced by these results. […]

Transform Variables


dplyr is an R package that allow you to manipulate data stored in data frames. It helps order, rearrange, sort, count, summarize, simplify, reduce or expand its contents (among others). dplyr offers a set of functions in the form of verbs which are easy to understand, to remember and to […]

Why dplyr?


Like any other package in R, if you have not installed/used it before on your machine, you will need to install it using the install.packages() command.   Simply type the following code in your console: install.packages("dplyr")   The following “victory screen” should appear:     Do not forget to activate […]

Installing dplyr


Using pipes is a great way to make your life in R simpler by chaining functions. It helps you apply a sequence of functions to a data set to obtain a final result without having to take care of intermediate results (the results of each single function/operation in the sequence). […]

Using pipes in dplyr