
dplyr and tidyverse (a larger package which includes dplyr) give the possibility to add columns (and thus variables) to an existing data frame. You may either add a new column from new data (usually based on the content of a vector, the content of another table or data frame, or simply from a simple series of numbers) or by computing new columns based on the content of one or several columns from the existing data frame (e.g. sum or mean of several variables located on the same row).
Here, we will review two functions that add new columns from new/external data. You may read more about how to compute new columns based on the content of one or several columns from the existing data frame HERE.
NB: some functions are part of dplyr but others are part of tidyverse. Should any of the following functions return an error message such as “could not find function …”, simply activate the package tidyverse using:
library(tidyverse)
The two functions are:
add_column(): add a new column based on a series of numbers, the content of a vector, etc.bind_cols(): add new columns based on the content of another data frame or table.- mutating join: add new columns based on the content of another data frame or table.
We also introduce a function which is useful when create new variables:
Add a new column based on a series of numbers, the content of a vector, etc with add_column()
In its simplest form, add_column() creates a new column at the end of the existing data frame, and adds the variable name and the data that you provide between the parentheses.
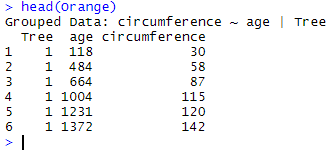
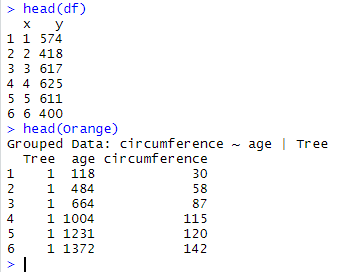
Let’s use the data frame Orange as an example. The top of the data frame looks like this:
head(Orange)
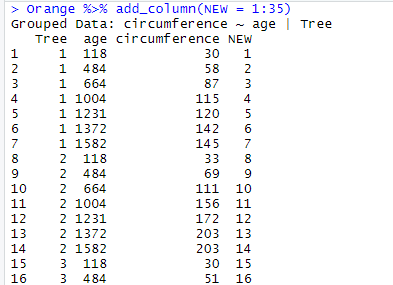
Here we want to add a column called NEW and for which the data are the integers ranging from 1 to 35 (i.e. the series 1:35):
Orange %>% add_column(NEW = 1:35)
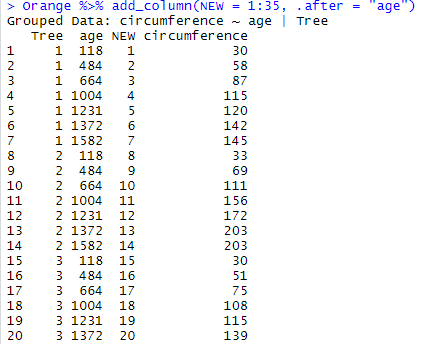
If we want to place that new column somewhere else than at the end of the table, we shall indicate the final position with .before =or .after =
Orange %>% add_column(NEW = 1:35, .after = "age")
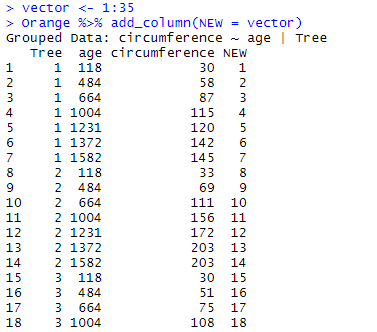
Finally, it is possible to use a vector containing the data to add to the data frame. Here, we use a vector called vector that contains the series 1:35:
vector <- 1:35
Orange %>% add_column(NEW = vector)
Add new columns based on the content of another data frame or table with bind_cols()
The function bind_cols() adds the columns of the data frames indicated between parentheses next to each other, starting from the left. We will see how this works using Orange and a second data frame called df for which the code is:
df <- data.frame(x = 1:35, y = sample(1:1000, 35))
df
Note that df must have has as many rows as Orange has (see here what happens otherwise. Here is the top of the data frames:
To bind them together, we write:
bind_cols(Orange, df)
which results in the following:
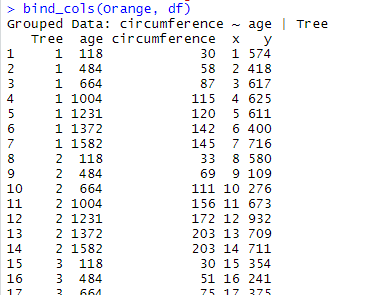
As you may see above here, the left columns of the new table are those from Orange while the right columns are those from df.
You may bind together only a selection of variables from each data frame. To do so, supply the position of the variable in its respective data frame between []:
bind_cols(Orange[1:2], df[2])
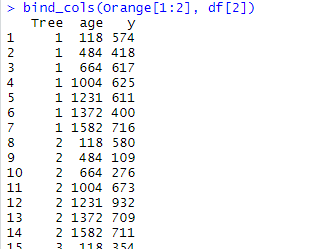
Here, the first two variables of Orange have been added to the second row of df.
The examples above were based on two data frames which equal length (same number of rows). What happens when these are not equal? Let’s try with a shorter data frame df2 for which the code is:
df2 <- data.frame(x = 1:15, y = sample(1:1000, 15))
df2
We bind them with bind_cols():
bind_cols(df, df2)
and obtain the following warning:
![]()
Indeed, merging data frames requires that these have the same amount of rows.
Renaming variables with rename()
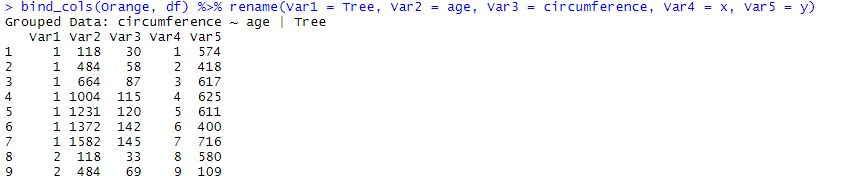
You may rename columns by using rename(). For each column, write first the new name of the variable followed by = and the original name:
bind_cols(Orange, df) %>%
rename(Var1 = Tree, Var2 = age, Var3 = circumference, Var4 = x, Var5 = y)
Add new columns based on the content of another data frame or table by using a mutating join
There is a family of four functions that allows for joining variables from two tables X and Y while matching values to the rows they correspond to. In other words, the functions check whether there are common rows and columns, before putting the data together. Using some of these functions may thus not only add columns, but also add rows. This family of functions is described in details HERE.