Excel16 -2- Descriptive statistics

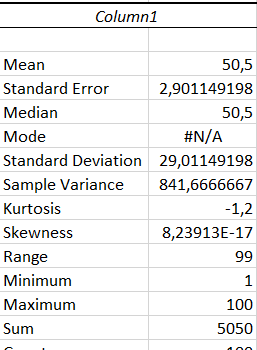
This chapter will show you how to quickly analyse a simple dataset and define basic values like average, variance, standard deviation, standard error of the mean, and so on. We’ll also see how to draw a histogram and a boxplot to better represent these datasets.


To calculate the variance of a series, you may choose between using the =VAR.P(...) and =VAR.S(...) functions. Both functions provide the variance, but based on different assumptions and therefore on slightly different formulas. Use =VAR.P(...) if the dataset that you analyse is a whole population.     Use =VAR.S(...) if […]

3. Calculate the variance


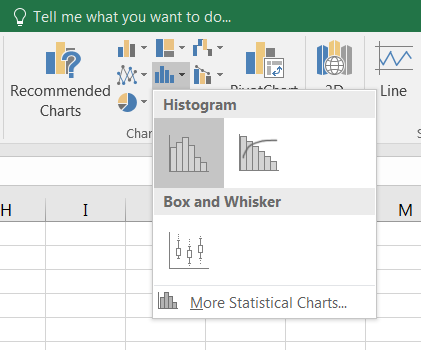
Often, the simplest way to visualize your dataset or sample will be through a histogram, also called frequency histogram. The histogram will eventually represent the distribution of the data and the shape of the chart will most certainly give you information on whether this distribution is symetrical, bimodal, skewed… To […]

8. How to draw a histogram


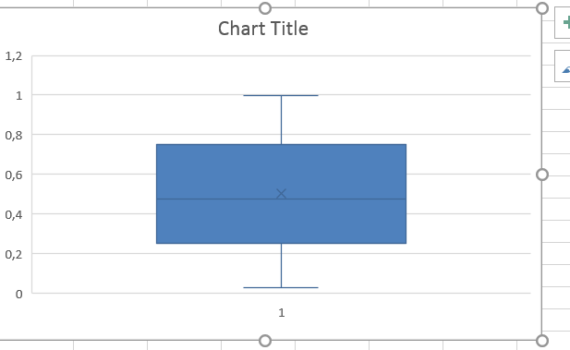
A boxplot (box plot, or whisker plot) is a compact, but efficient way to represent a dataset using descriptive stats. This “little diagram” combines informative, standard values such as the first and third quartiles (the bottom and top of the box, respectively), the median (the flat line inside the box) […]

9. How to draw a boxplot