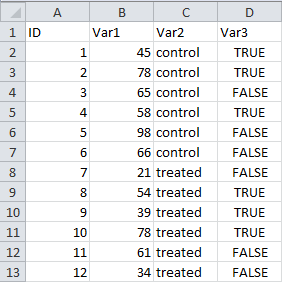
Let’s see first how you can create a file in MS Excel that can be read by R and which will keep the data structure intact. Here is an example of a simple data table in MS Excel:
 This table contains 4 columns and 13 rows. This first row contains the name of the variable names:
 ID, Var1, Var2 and Var3. The other rows are 12 independent observations. The case number of each observation is found in the first column. In the second column, you find the numerical variable Var1. In the third column, the categorical variable Var2, and in the last column, the boolean (TRUE vs. FALSE) variable Var3.
To build a .csv file containing these data elements, follow this procedure:
File>Save as...mydata)Save as type, select CSV (Comma delimited) (*.csv)Save. The file mydata.csv is now created where you asked it to be.

YES/OK. You may also get a message saying that the CSV file to be created will only contain the active sheet in the original Excel file, not the whole Excel file.
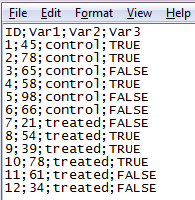
 If you are curious enough, you might want to check how the data in the CSV file look like. Open it in Notepad or any text editor and you’ll see what is depicted on the picture to the right. As you see, the first line contains the variables
 ID, Var1, Var2 and Var3. The following lines contains the observations. All data elements are separated from each other by a semi-colon ; which keeps the structure of the table intact.
Note that a semi-colon has been used by MS Excel to create a Comma-Separated Values file, something which might sound weird… This is due to the regional setting of Windows on my PC. It is not a problem at all in terms of import/export of the data, but that has to be kept in mind when importing the .csv file into R (see here for an example).
