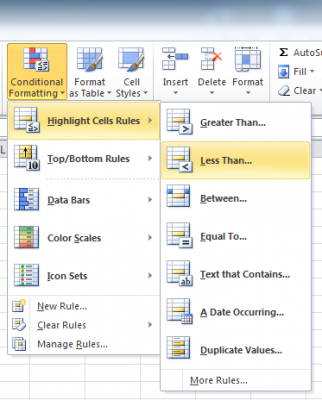
 When you start handling tens or hundreds of cells and need to know, for example, where the cells with the 10 highest and 10 lowest values are located, you clearly hope that there exists a button somewhere in the ribbon that can pick and mark those cells for you. Well… that button exists and may be found in the
 Styles section of the Home ribbon (see picture to the right). As you see in the menu, you may use pre-existing rules to highlight your data (such as highlighting the cells containing values greater than or equal to the value of your choice or to the average), rules to reveal duplicates, rules to highlight the top 5 or top 10 values in the table… You may also use color scales to give the lower values a specific color while the higher values are in a different color… Watch this video for an example.
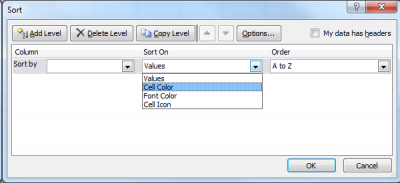
 Now, cells which have been highlighted using this conditional formatting can be sorted by color codes. As explained above, use the
 Custom sort... option in the Sort&Filter function (see picture to the right) to sort your table using cell color or even font color as a parameter. Not only your values of interest will be visible, but also cleanly arranged. Watch a video here.
