
Everything starts with a clean dataset! A clean dataset means that:
- the independent and dependent variables are organised in columns,
- each column has a unique title (header),
- each row has only one entry per variable,
- empty cells in the table should be avoided.
Let’s take an example. We conduct an experiment where herring larvae were measured at different time points of their early life. These larvae were reared under different conditions of light and salinity, in 9 different tanks. Once a week, 10 individuals were taken from these tanks and their length was measured.
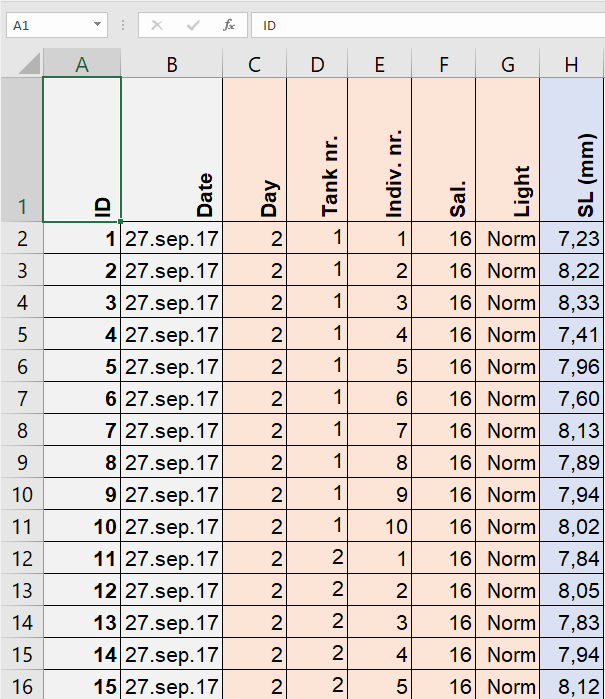 The following table shows the corresponding dataset, where:
- ID is the number of the entry,
- Date is the date of measurement,
- Day is the age of the individual (number of days post hatching, ranging from 2 to 51),
- Tank nr. is the number of the tank the larva was taken from (ranging from 1 to 9),
- Indiv. nr. is the number of the individual taken from the tank on a given day (ranging from 1 to 10),
- Sal. is the salinity in the tank from which the fish was taken (either 16 or 35 psu),
- Light indicates whether the light regimen was normal (Norm) or offset (Offset),
- SL (mm) is the length of the larva in millimeters.
The full dataset can be downloaded here.
In this table, all entries are unique. There is only one entry per row. All variables (independent and dependent) are displayed in columns. The header contains unique labels for the variables. So far, so good! But it is useful to checkthat there is no empty cell in that table, as empty cells might interfere with the sorting of data by category in the final pivot table.
To find these empty, you may use the Filter function in Sort & Filteron the whole table (see how to use Sort & Filter here).
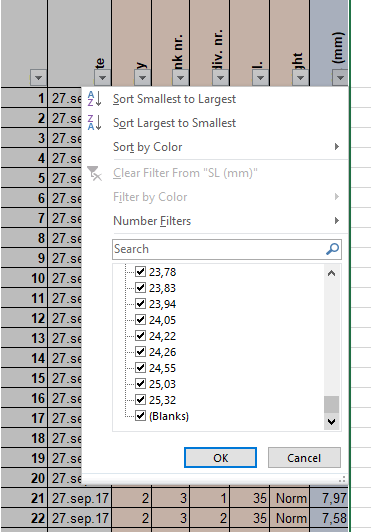 Let’s check for example whether there are empty cells in the column
 SL (mm). Select the area from A1 to H721, click on Sort & Filter, then Filter, click on the arrow next to SL (mm). The mere fact that there exists a box called (Blanks) tells you that there exists at least one empty cell in that column.
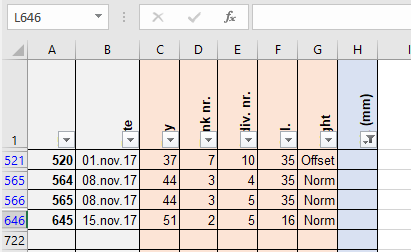 Unselect all boxes except from
 (Blanks) and click OK. The remaining table shows that entries 521, 565, 566 and 646 are not complete. You may thus decide to replace the empty cell with NA, or to delete these rows.
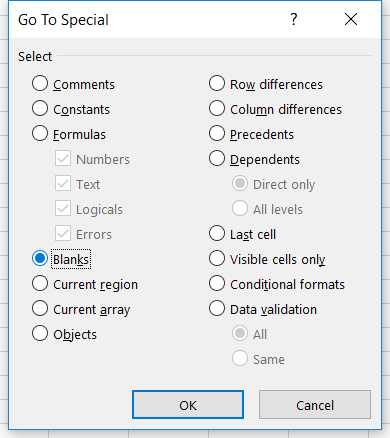 Another way to spot empty cells is to select the whole table (A1-H721) and use the
 Find & Select tool and Go to Special... In the dialog box, select Blanksand then OK. Excel spots and selects automatically the first empty cells it finds in the select area. Press then on Enter to find the next empty cell, and so on.