
A pivot table is a table that displays statistics generated from a larger table that contains your “raw” data set. This pivot table may display counts, sums, averages and other statistics describing variability. It thus allows you to get an overview over thousands of data points within a few clicks. […]
Excel16 -6- Pivot tables
Everything starts with a clean dataset! A clean dataset means that: the independent and dependent variables are organised in columns, each column has a unique title (header), each row has only one entry per variable, empty cells in the table should be avoided. Let’s take an example. We conduct an […]
2. Preparing the table for a pivot table
To create a pivot table from the dataset introduced previously here (and downloadable here), select the table (A1-H721), choose Insert in the main menu, and Pivot Table. In the dialog box that shows up, you may choose the data (if it is […]
3. Creating the pivot table
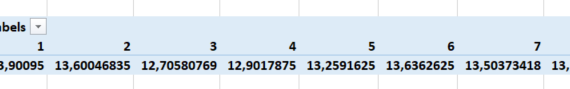
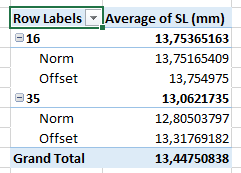
In this post, we keep using the example introduced here. We had built a pivot table showing the standard length SL (mm) for each of the 9 tanks. The side menu looked like this. And the pivot table looked like this. […]
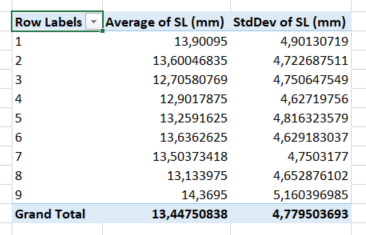
4. Displaying several statistics in a pivot table
In this post, we keep using the example introduced here. We had built a pivot table showing the standard length SL (mm) for each of the 9 tanks. The side menu looked like this… …and the pivot table looked like this. In […]
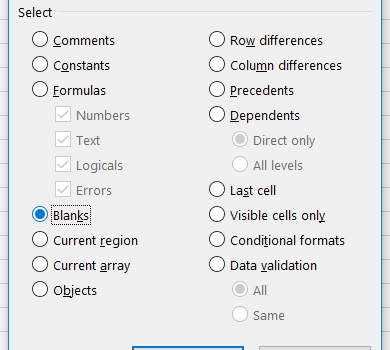
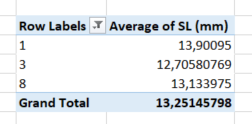
5. Displaying a subset of a category in a pivot table
In this post, we keep using the example introduced here. We had built a pivot table showing the standard length SL (mm) for each of the 9 tanks. The side menu looked like this… …and the pivot table looked like this. In […]