In this section “Transforming data with dplyr”, we will study the most interesting/useful functions in dplyr using concrete examples in biology. These examples are:
- – a pair of data frames called
BCIandBCI.env(BCI: Barro Colorado Island Tree Counts) found in the packagevegan. The documentation aboutveganmay be found here, - – a simpler data frame called
Orangewhich documentation may be found here.
About the data frames in vegan
Description
Tree counts in 1-hectare plots in the Barro Colorado Island and associated site information.
Usage
data(BCI)
data(BCI.env)
Format
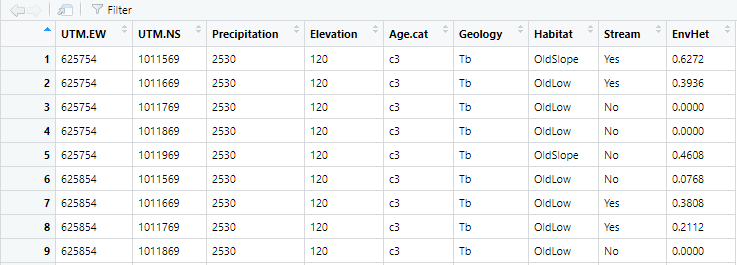
A data frame with 50 plots (rows) of 1 hectare with counts of trees on each plot with total of 225 species (columns). Full Latin names are used for tree species. The names were updated against http://www.theplantlist.org and Kress et al. (2009) which allows matching 207 of species against doi: 10.5061/dryad.63q27 (Zanne et al., 2014) […] For BCI.env, a data frame with 50 plots (rows) and nine site variables derived from Pyke et al. (2001) and Harms et al. (2001) […].
Reference: Package ‘vegan’, https://cran.r-project.org/web/packages/vegan/vegan.pdf
Quick overview of BCI
data(BCI)
View(BCI)
Quick overview of BCI.env
data(BCI.env)
View(BCI.env)
About the data frame Orange
Description
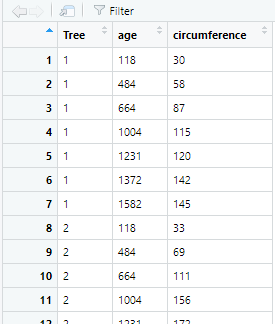
The Orange data frame has 35 rows and 3 columns of records of the growth of orange trees.
Format
An object of class c(“nfnGroupedData”, “nfGroupedData”, “groupedData”, “data.frame”) containing the following columns:
- Tree: an ordered factor indicating the tree on which the measurement is made. The ordering is according to increasing maximum diameter.
- age: a numeric vector giving the age of the tree (days since 1968/12/31).
- circumference: a numeric vector of trunk circumferences (mm). This is probably “circumference at breast height”, a standard measurement in forestry.
Reference: ‘Growth of Orange Trees’, https://stat.ethz.ch/R-manual/R-patched/library/datasets/html/Orange.html
Quick overview of Orange
data(Orange)
View(Orange)


