
The function summarize() (which may also be written summarise()) creates a table in which you will find the result(s) of the summary function(s) you have chosen to apply to a data frame. The summary functions may be:
mean(): which returns the mean of a variable,sd(): which returns the standard deviation of a variable,median(): which returns the median of a variable,min(): which returns the minimum value of a variable,max(): which returns the maximum value of a variable,var(): which returns the variance of a variable,sum(): which returns the sum of a variable,- etc.
To apply one or more of these summary functions to a data frame, you just have to indicate in summarise() which function(s) you want to apply and on which variable of the data frame. The syntax is:
summarise(dataframe, function1(variable), function2(variable), ...)
Alternatively, using pipes, the syntax is:
dataframe %>%
  summarise(function1(variable), function2(variable), ...)
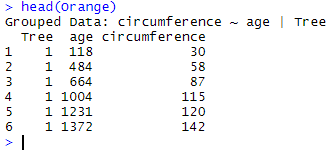
Let’s use the data frame Orange as an example. The top of the data frame looks like this:
head(Orange)
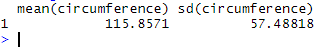
To calculate the mean and the standard deviation of the variable circumference, we write either
summarise(Orange, mean(circumference), sd(circumference))
OR
Orange %>%
  summarise(mean(circumference), sd(circumference))
which both result in:
This example actually does not make much sense in terms of biology. Indeed, we have calculated the average of circumference for different trees, but considering measurements performed at 7 different time points… Instead we could calculate the average circumference and standard deviation for each time point described in age by using group_by on the variable age (read more about group_by here).
To calculate the group means and standard deviations of the variable circumference, we write:
Orange %>%
  group_by(age) %>%
  summarise(mean(circumference), sd(circumference))
which results in:
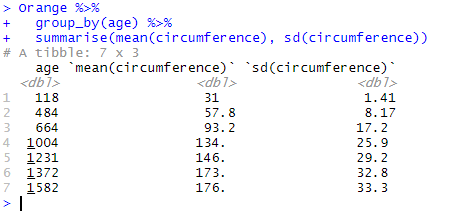
Each line in the result table now shows the mean and standard deviation for each of 7 factors in age described in the first column.