
In this post, we keep using the example introduced here. We had built a pivot table showing the standard length SL (mm) for each of the 9 tanks.
 The side menu looked like this.
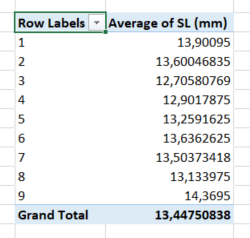
And the pivot table looked like this.
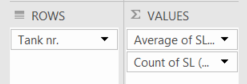
To add an extra statistic to the table, go to the side menu and drag and drop again SL (mm) from the list of available fields down to the box Σ VALUES. Now you should have two fields about SL (mm) in Σ VALUES. The first one should still be called Average of SL (mm) while the second one shows Count of SL (mm).
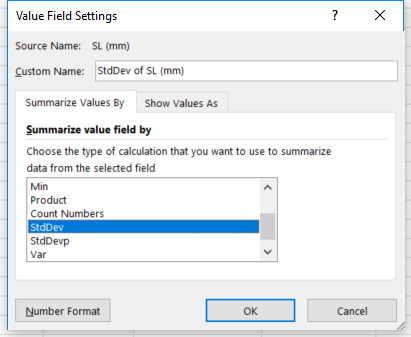 As we did before, click on
 Count of SL (mm), choose Value Field Settings... , select the new statistic to display (here we may choose StdDev for standard deviation) and click OK.
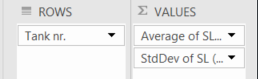 The side menu now looks like this.
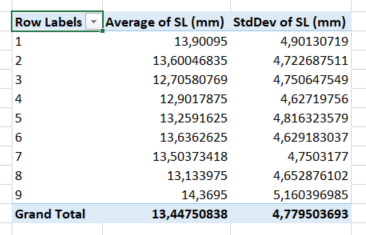 And the table now displays both
 Average of SL (mm) and StdDev of SL (mm) for each of the 9 tanks