
In this post, we keep using the example introduced here. We had built a pivot table showing the standard length SL (mm) for each of the 9 tanks.
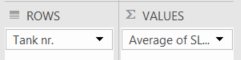 The side menu looked like this…
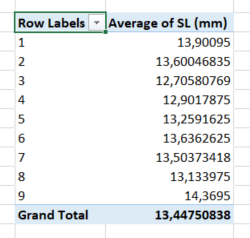
…and the pivot table looked like this.
In many cases, you will be interested in only a few “items” in a category, for example 3 out 9 tanks in our experiment. There are three easy ways to select a subset:
- using the
FILTERSbox in the side menu - selecting a subset via the
Row Labelsmenu in the pivot table
Using the FILTERS box in the side menu
In this example, we want to restrict the display to only 3 tanks (1, 3 and 8).
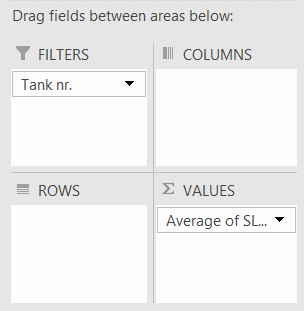
Let’s move the SL (mm) field from the ROWS box to the FILTERS box.
 The majority of the cells in the pivot table disappears, and a new box with
 Tank nr. (All) appears over the remains of the pivot table, followed by an arrowhead.
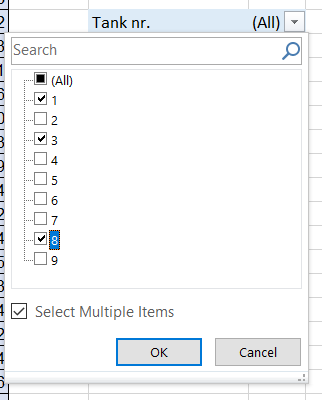 First, click on the arrowhead. Now, tick the
 Select Multiple Items box to make each single item clickable. Then, choose 1, 3 and 8 and OK.
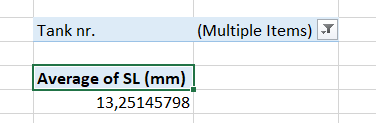
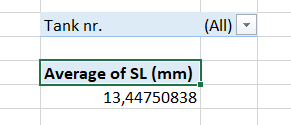
The result is an extremely simple table with a single value that is the average of SL (mm) for tank nr. 1, 3 and 8 altogether, but this does not show you individual averages for the tanks.
Selecting a subset via the Row Labels menu
In this example, we want to restrict the display to only 3 tanks (1, 3 and 8).
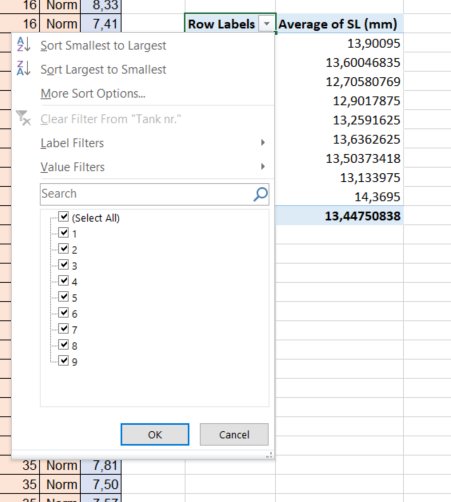 Let’s click on the arrowhead located to the right of
 Rows Labels in the top left corner of the pivot table. A menu appears that let’s you tick off items in the category that has been added to ROWS in the side menu (here it is Tank nr.).
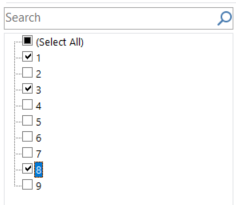 Simply select the values of interest (1, 3 and and 8) and click
 OK.
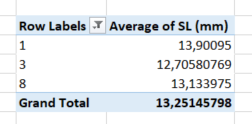
The resulting pivot table now shows Average of SL (mm) for the tanks nr.1, 3 and 8 only, and adds a grand total at the bottom which is based on these three items only (and not the whole table).