
In this post, we keep using the example introduced here. We had built a pivot table showing the standard length SL (mm) for each of the 9 tanks.
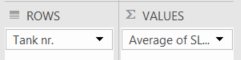 The side menu looked like this…
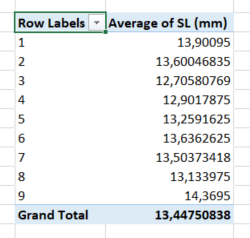
…and the pivot table looked like this.
In many cases, you will be interested in looking at statistics for subgroups in your data set that match combinations of parameters. For instance, you could be interested in looking at the standard length of fishes that were exposed or not to an offset light pattern AND a specific salinity in the tank.
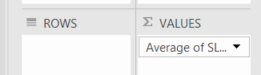 In our practical example, we will keep looking at
 Average of SL (mm), but we will not need to split in tanks any longer. Therefore we remove the field Tank nr. from the box called ROWS. Do so be clicking on Tank nr. and choosing Remove Field.
Now, we shall add the two independent variables Light and Salinity in the table. Whether we decide to have Light conditions in rows and Salinity in columns, or Salinity in rows and Light conditions in columns, or both in rows or columns, is essentially a question of personal “taste”… but this choice might influence the readability of your pivot table. Let’s have a look at the different cases:
- Light conditions in rows and Salinity in columns,
- Salinity in rows and Light conditions in columns,
- Both in rows or columns.
Light conditions in rows and Salinity in columns
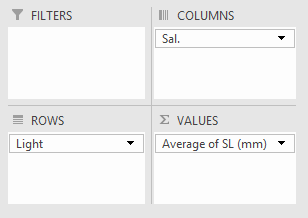 Let’s drag
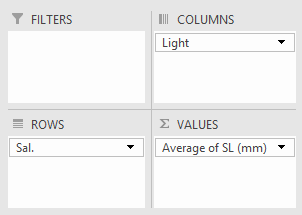
 Sal. into the box COLUMNS and Light into the box ROWS. Average of SL (mm) shall remain in Σ VALUES.
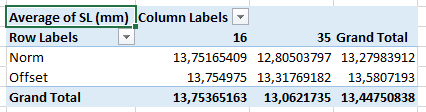 The corresponding pivot table appears. As expected both levels of Light conditions (Norm, Offset) are displayed in rows, and both levels of Salinity (16, 35) are displayed in columns. In the table, the
 Average of SL (mm) is calculated for each of the 4 subgroups (Norm x 16, Norm x 35, Offset x 16, Offset x 35).
Salinity in rows and Light conditions in columns
 Let’s drag
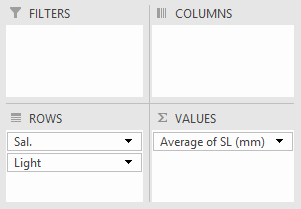
 Light into the box COLUMNS and Sal. into the box ROWS. Average of SL (mm) is still in Σ VALUES.
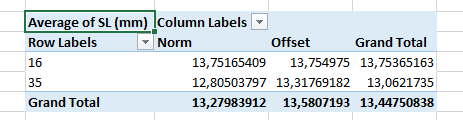 The corresponding pivot table appears. Again, as expected both levels of Light conditions (Norm, Offset) are displayed in columns, and both levels of Salinity (16, 35) are displayed in rows. In the table, the
 Average of SL (mm) is calculated for each of the 4 subgroups (Norm x 16, Norm x 35, Offset x 16, Offset x 35).
Both in rows or columns
Let’s drag both Light and Sal. into the box ROWS. Average of SL (mm) is still in Σ VALUES. Note that we place Sal. above Light in the box.
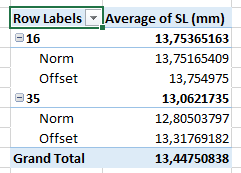 The corresponding pivot table appears. This time, the first level of Salinity (16) is displayed in the first row, followed by the two levels of Light condition (Norm, Offset); then comes the second level of Salinity (35), followed by the two levels of Light conditions (Norm, Offset). The display of the pivot table has thus followed the order of the variables as presented in the
 ROWS box of the side menu.