In R base graphics, there is no function that will directly draw a line chart on its own. Instead, you will need to start with a regular scatter plot with your data represented as dots for example, and then join the dots with lines. While the scatter plot will be drawn by plot() as explained here, the lines will be displayed by the function lines(). The way to code for lines is as follows: lines(x, y, type=”[option]”) where [option] is one of the possibilities represented here:

As you can see, there are several ways to draw a line between two consecutive points; in R base graphics, it does not have to be necessarily a straight line. On top of that, lines() allows you to add vertical lines from the X-axis up to the data point.
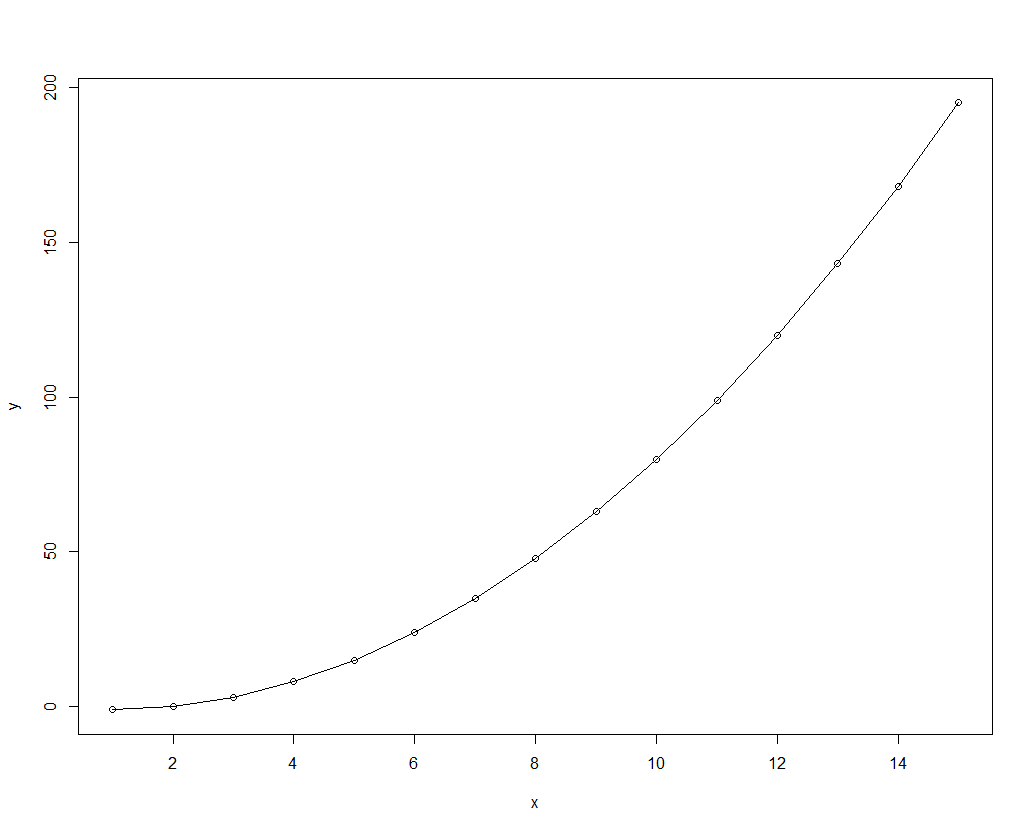
Here are a few examples and their code. First, a plot with lines going through the dots:
x <- 1:15
y <- x*x-2*x
plot(x,y)
lines(x, y, type="o")
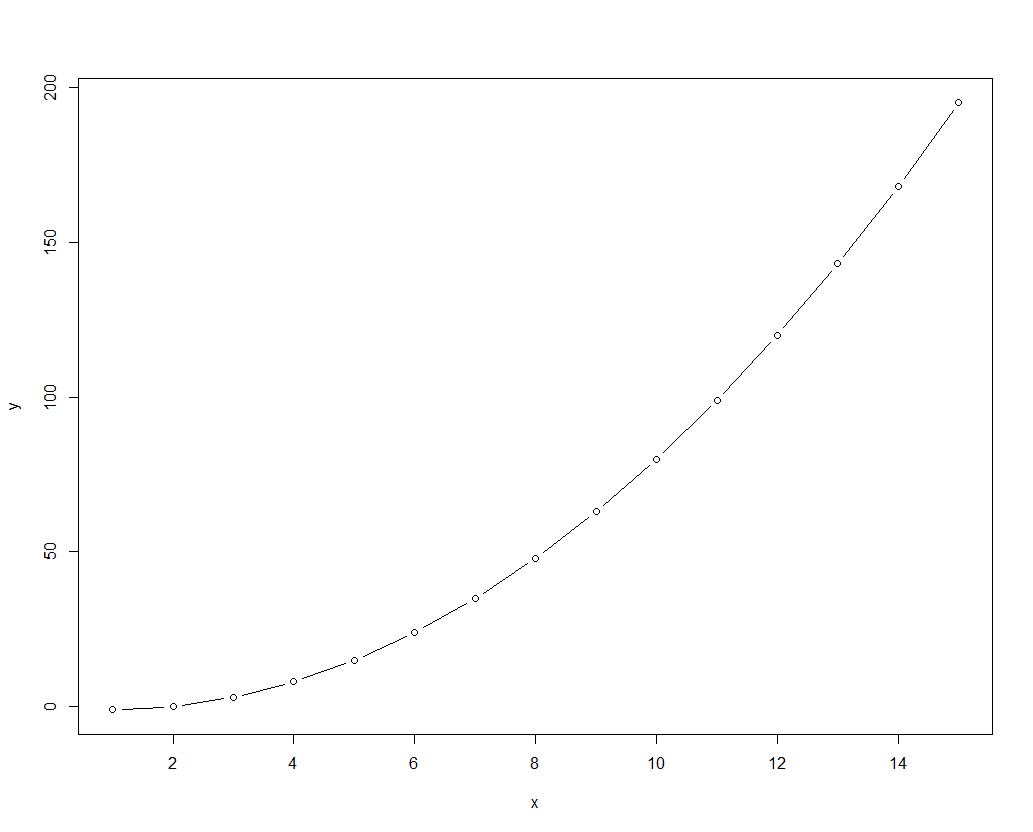
Then we can draw the same plot, but this time with lines between the dots instead of through the dots:
x <- 1:15
y <- x*x-2*x
plot(x,y)
lines(x, y, type="c")
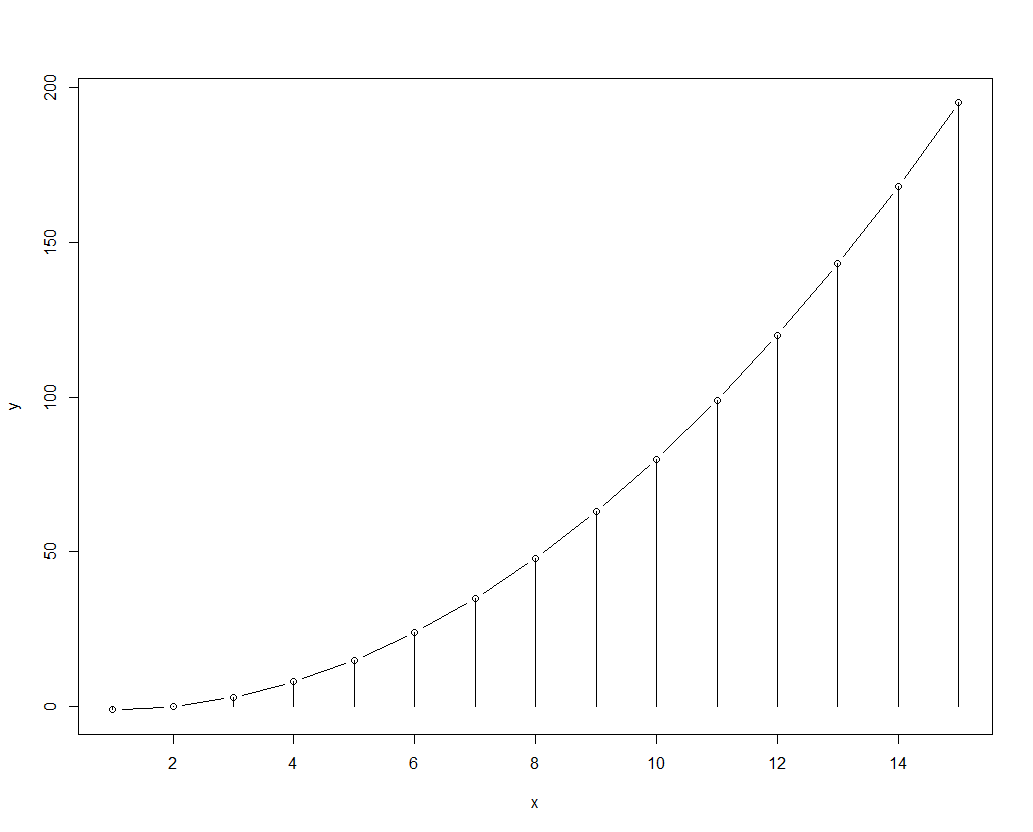
Then again, we draw that same plot with lines between the dots AND with lines from the X-axis up to the data point (indeed, you can add several line types to the same graph; just use several instances of lines()):
x <- 1:15
y <- x*x-2*x
plot(x,y)
lines(x, y, type="c")
lines(x, y, type="h")
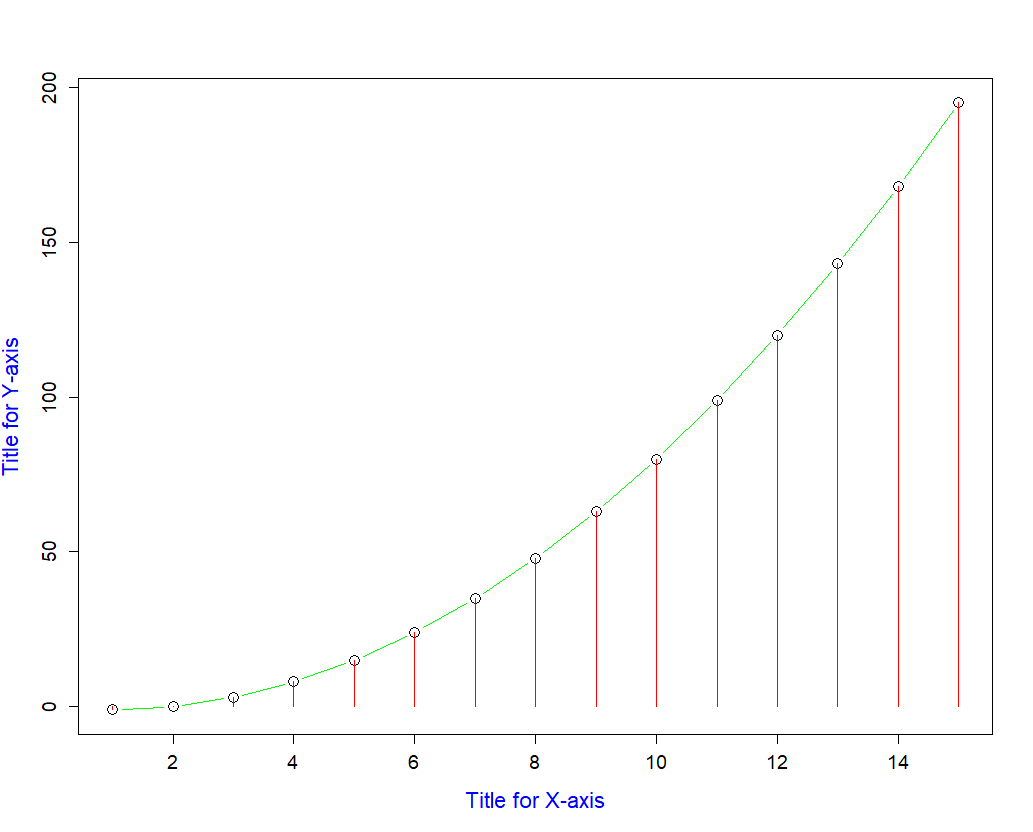
And as usual, you can add colors, titles and so on:
x <- 1:15
y <- x*x-2*x
plot(x,y,
xlab="Title for X-axis",
ylab="Title for Y-axis",
cex=1.5,
cex.lab=1.4,
cex.axis=1.2,
col.lab="blue")
lines(x, y, type="c", col="green" )
lines(x, y, type="h", col= "red")