
Excel -2- Descriptive statistics

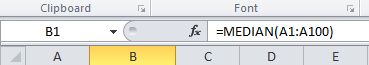
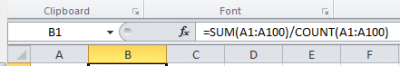
To calculate the average of a dataset, you may use one of the following options: 1) divide the sum of the dataset by the number of values in this dataset (which is by definition how the average is to be calculated). The sum can be easily obtained with the […]

To determine the median of a dataset, you may use one of the following options: 1) Select the whole dataset (A1:A100) and sort it from the smallest to the largest value using the Sort Smallest to Largest functionality which you will find by clicking on the Sort & Filter […]
2. Determine the median

To calculate the variance of a series, you may choose between using the =VAR.P(...) and =VAR.S(...) functions. Both functions provide the variance, but based on different assumptions and therefore on slightly different formulas. Use =VAR.P(...) if the dataset that you analyse is a whole population. Use =VAR.S(...) […]
3. Calculate the variance

The standard deviation may be calculated using one of the following options: a) the standard deviation is actually the square root of the variance. In MS Excel, this can be written =SQRT(VAR(...)). In our case, type =SQRT(VAR(A1:A100)). b) use the formula =STDEV.S(...) or =STDEV.P(...) to get the standard deviation of the […]
4. Calculate the standard deviation

The standard error of the mean may be calculated by dividing the standard deviation by the square root of the number of values in the dataset. There is no direct function in MS Excel to get it automatically. Therefore, you must refer to the its definition and type =STDEV(...)/SQRT(COUNT(...)). In […]
5. Calculate the standard error of the mean (SEM)

To find the minimum and maximum values in the dataset, you may: a) sort the dataset (A1:A100) using the Sort Smallest to Largest functionality which you will find by clicking on the Sort & Filter icon, in the Editing section of the ribbon under the Home tab. Simply retrieve the […]
6. Find the minimum, the maximum and the range.

There is a way to obtain most, if not all, of the values detailed above in this page by using a tool package in MS Excel. This tool package is called “Analysis Toolpak” and provides the mean, standard error, median, standard deviation, sample variance, range, minimum, maximum, sum, count and […]
7. Use the data analysis package

Often, the simplest way to visualize your dataset or sample will be through a histogram, also called frequency histogram. The histogram will eventually represent the distribution of the data and the shape of the chart will most certainly give you information on whether this distribution is symetrical, bimodal, skewed… This […]
8. How to draw a histogram

A boxplot (box plot, or whisker plot) is a compact, but efficient way to represent a dataset using descriptive stats. This “little diagram” combines informative, standard values such as the first and third quartiles (the bottom and top of the box, respectively), the median (the flat line inside the box) […]