
Using pipes is a great way to make your life in R simpler by chaining functions. It helps you apply a sequence of functions to a data set to obtain a final result without having to take care of intermediate results (the results of each single function/operation in the sequence). But what does “chaining” mean?
Let’s take take the analogy of a trip from A to F. This trip has 4 stops or waypoints before reaching the final destination: the first one at B, then C, then D, then E. To describe this trip, you may list each of the legs:
- A->B,
- B->C,
- C->D,
- D->E,
- and E->F.
This is a bit tedious though. There are simpler ways to describe the trip, for example in the form of a chain:
- A->F via B, C, D and E,
- or A->B->C->D->E->F.
These two chains imply that you have actually stopped at each intermediate waypoint and then started your journey again to reach the next waypoint on the list. Note that the sequence of waypoints is implied in the syntax of the chain.
Chaining in R (and dplyr) consists in listing functions to be applied to a data set, in a sequence that is implied by the syntax, and without having to take care of intermediate results (the result of each function in the list). Using pipes or piping in R (and dplyr) consists in writing such chains using the operator %>%.
Here is a very simple, however not so meaningful example. We start with a vector a made of 100 random values created with rnorm(). We first calculate the average of x using mean() and store it in y, then we calculate the square root of y and store in z, and finally we multiply z it by 42. Traditionally we would have written:
x <- rnorm(100, mean = 50, sd=5)
y <- mean(x)
z <- sqrt(y)
round(z,1)
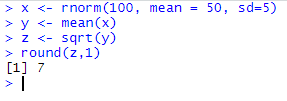
Of course we could have written this in the form of nested functions:
round(sqrt(mean(x)),1)
![]()
and obtained the same result, but this looks rather messy and quite unreadable, especially if the sequence of functions is much longer… In addition, the sequence of events appears inverted (first round() then sqrt() and finally mean()).
Using pipes, this would have been written the following way:
x %>%
  mean()%>%
  sqrt()%>%
  round(1)
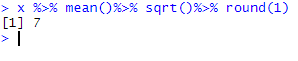
Contrary to the previous line of code, this way to write is more readable and the sequence of events is more logical: first the mean, then the square root and finally the rounding. Back to the trip analogy, we could have said that we started our journey from x, then went to mean(), then to sqrt(), and then to round(). The symbol %>% is thus somehow translated in then.
Throughout this chapter, we will study several of the most useful functions in dplyr. In most cases, we will apply some forms of piping, sometimes using group_by() as first element in the chain. We will go through the use of group_by() here.
Finally, in a similar way to ggplot2, we may write pipes over several lines to make the code clearer. Instead of writing:
x %>% mean()%>% sqrt()%>% round(1)
one would write:
x %>% mean()%>% sqrt()%>% round(1)