
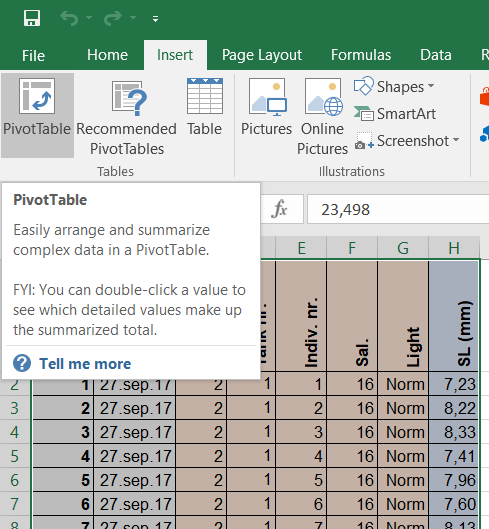
 To illustrate this, we will create a pivot table from a dataset introduced in the chapter "Pivot Tables" (and downloadable here). The whole procedure is described here. In brief, select the table (A1-H721), choose
 Insert in the main menu, and click Pivot Table. In the next dialog box, simply choose a place for the table and click OK.
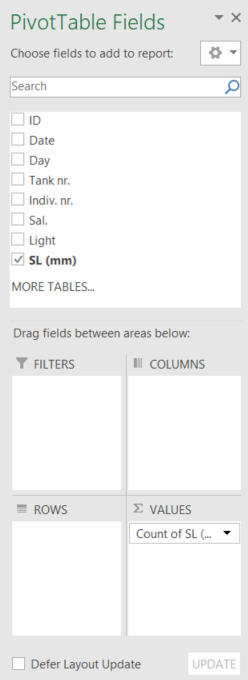 The new menu
 PivotTable Fields that appears to the right of your screen will help you set up the pivot table. First, select a dependent variable to display in the pivot table, here the standard length (SL (mm)). To do so, click and hold SL (mm), then drag it in the box Σ VALUES in the lower right corner of the side menu.
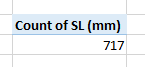 In the worksheet, a pivot table made of 2 cells has appeared, showing
 Count of SL (mm) and 717. This count (which is the default setting when creating the pivot table) tells you how many cells in the SL (mm) column contain data (all kind of data). Knowing that there are 720 entries in the table, you can conclude that there are 3 empty cells in the table. A rapid search for blank cells (see here how to search for blank cells) in the table shows that the cells H565, H566 and H646 are indeed empty.
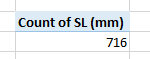 You may change the parameters in the
 Σ VALUES field of the side menu at any time in order to display other statistics about the table. Simply click on Count of SL (mm)and choose Value Field Settings... . Change now from Count to Count Numbers. Count Numbers will count all the cells which contain numerical data. Any other content such as text (or numerical data which is not recognized as a number due to the use of incorrect decimal separators) will not be counted. The value in the pivot table is now 716. Knowing that there are 717 non-empty cells in the table, you can conclude that 1 cell contains something else than a number. A rapid search throughout the table shows that the cell H521 contains indeed the value N/A.
NB: note that the label Count of SL (mm) in the table is the same whether you selected Count or Count Number in the settings.
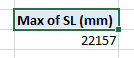 In the list of parameters available in
 Value Field Settings..., you will also find Min and Max. Using (one of) these, you will be able to find the lowest and/or the highest value(s) in the table. Should a value be clearly outside the expected range, you will be able to highlight it rapidly. Using Max in our example, we quickly realize that there is an unexpectedly high value in the table (22157), something that can clearly be seen as a mistake considering that this should have been the size in millimeters of a herring larva. We can then search for that value in the table and find that it is located in the cell H645.