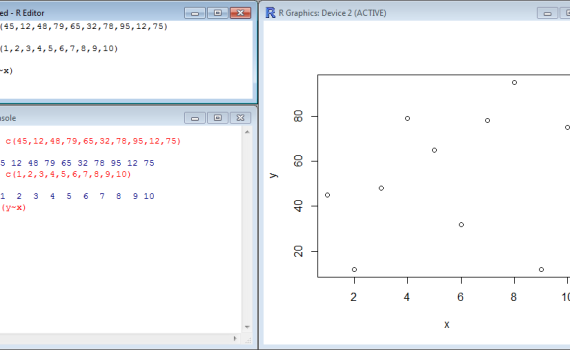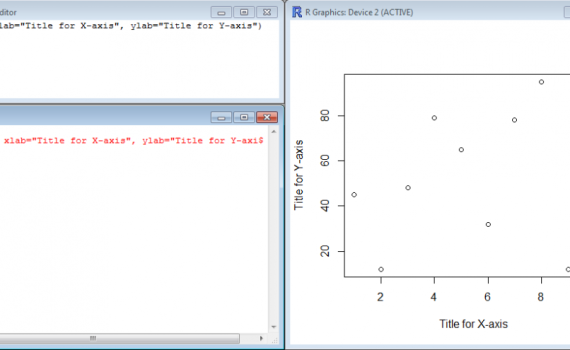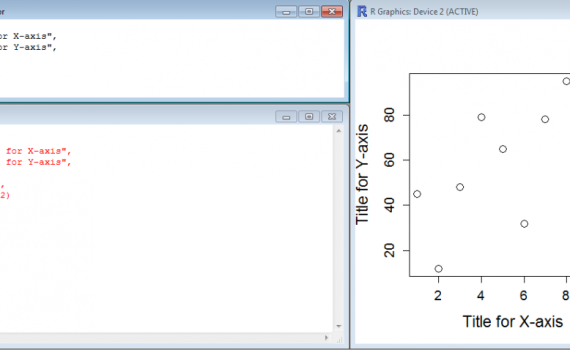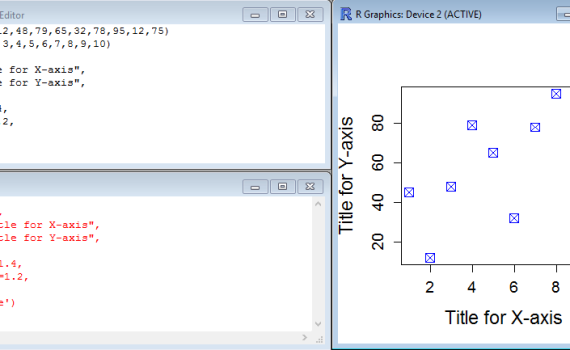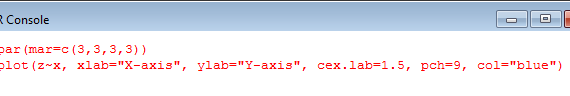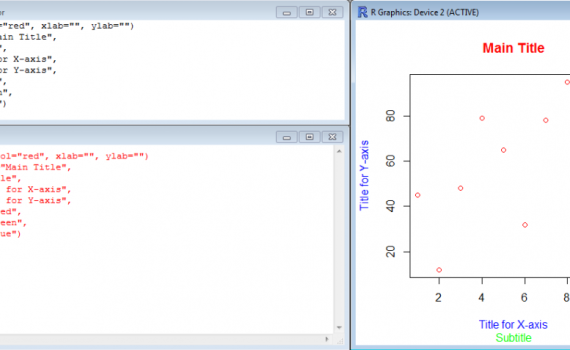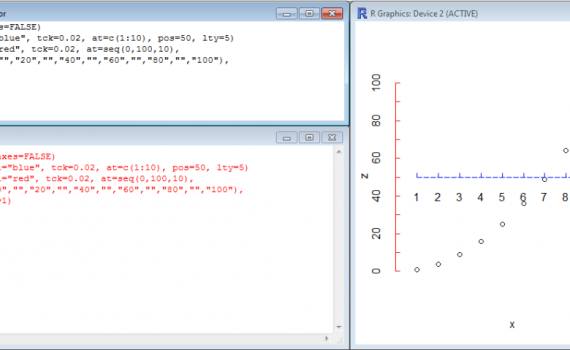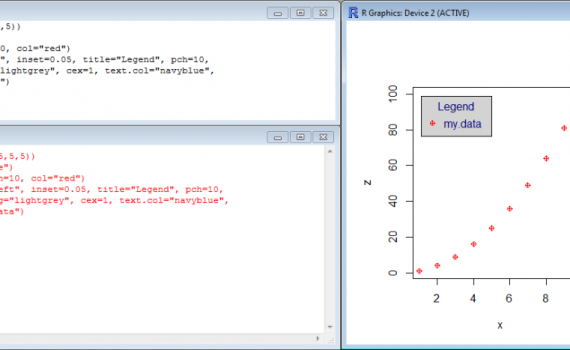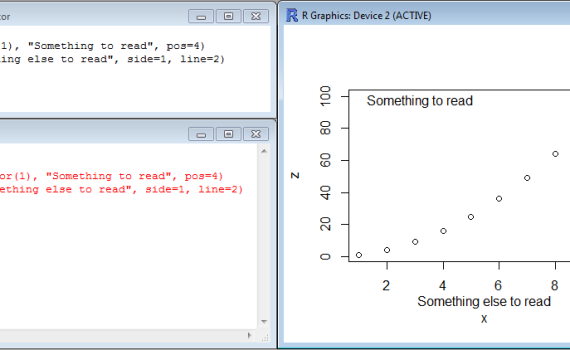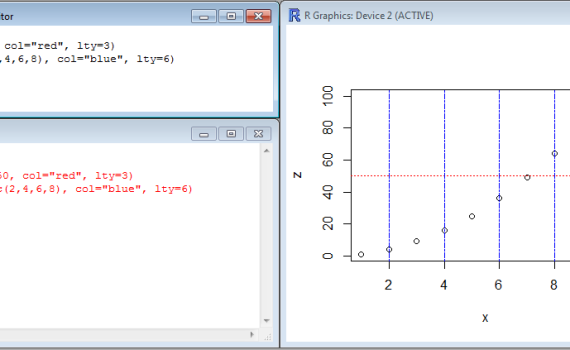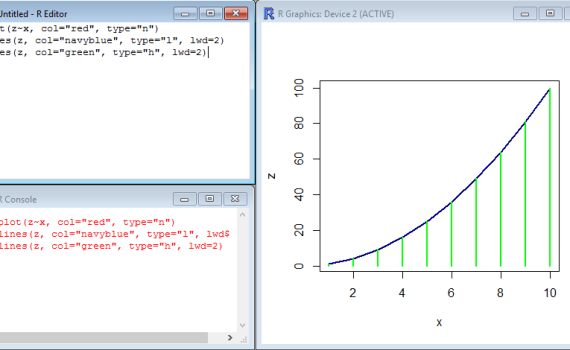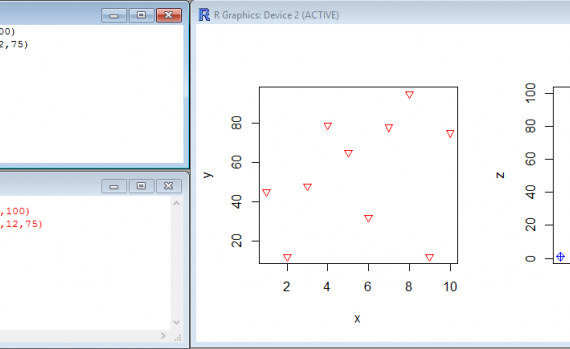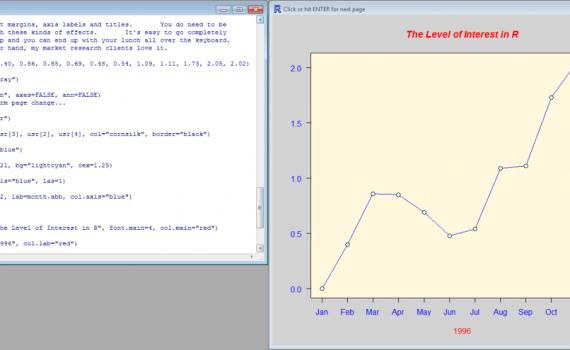
You may get a taste of it by using the command demo(graphics). The command brings up a series of examples of what can be “easily” created in R using few, simple lines of command. Conveniently, the R console displays the commands at the same time as the chart is built […]