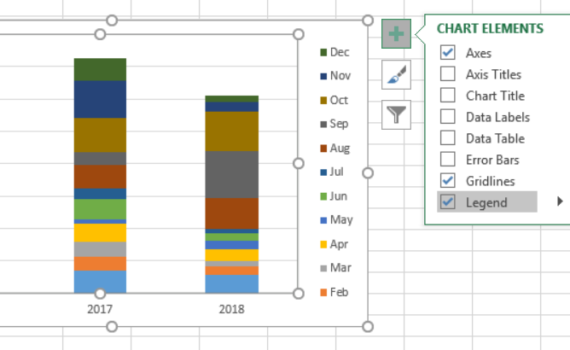
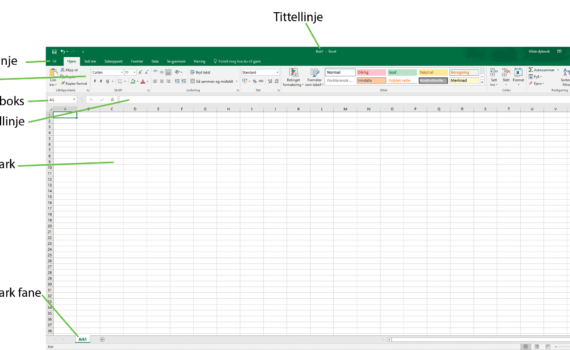
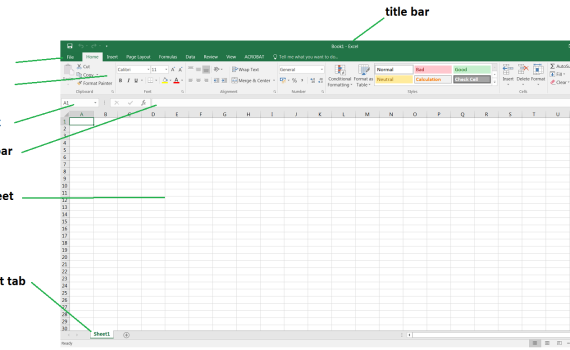
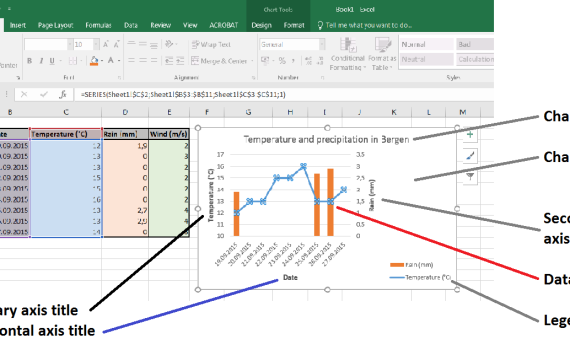
Yearly Archives: 2016


It is not so often that one gets to use a pie chart… and it is not so often that such a chart is used for the right purpose. Pie charts can be used to represent different categories of a population, polls, data referring on proportions and percentage. Let’s learn how to make […]

11. Make a pie chart


You may realize, looking at the pie chart that we just made previously, that the design of the chart area is rather inadequate. The chart itself is ridiculously small compared to the legend. This is essentially due to a default setting that MS Excel uses and which restricts the size/position of the […]

12. Resize the legend box


To calculate the variance of a series, you may choose between using the =VAR.P(...) and =VAR.S(...) functions. Both functions provide the variance, but based on different assumptions and therefore on slightly different formulas. Use =VAR.P(...) if the dataset that you analyse is a whole population.     Use =VAR.S(...) if […]

3. Calculate the variance


Often, the simplest way to visualize your dataset or sample will be through a histogram, also called frequency histogram. The histogram will eventually represent the distribution of the data and the shape of the chart will most certainly give you information on whether this distribution is symetrical, bimodal, skewed… To […]

8. How to draw a histogram


A boxplot (box plot, or whisker plot) is a compact, but efficient way to represent a dataset using descriptive stats. This “little diagram” combines informative, standard values such as the first and third quartiles (the bottom and top of the box, respectively), the median (the flat line inside the box) […]

9. How to draw a boxplot


Når man starter opp MS Excel 2016 åpner programmet en tom arbeidsbok og filen har standardnavnet “Bok1” (som indikert i toppen av vinduet, tittellinje). Arbeidsboken inneholder et enkelt regneark kalt “Ark1”, representert av fanen nederst i vinduet. Når man åpner programmet inneholder MS Excel vanligvis: – En menylinje (Fil, Hjem, […]

1. Kom i gang med MS Excel 2016


When first starting MS Excel 2016, the program opens an empty workbook file named by default “Book1” (as indicated in the title bar on the top of the window). This workbook contains a single empty worksheet called “Sheet1” represented by the a tab at the bottom of the window. In its most common […]

1. Starting up MS Excel 2016


  Default workbooks always come with a single empty worksheet. At any time, you may add a new worksheet to your workbook just by clicking on the icon + next to the tab for the current workbook. The new sheet automatically appears to the right of the last one. Note that the combination Shift+F11 […]

2. Opening a new worksheet


  Du trenger ikke være OCD (obsessiv-kompulsiv lidelse) for å organisere og rydde i dataene dine. Det er faktisk en veldig god praksis å sortere tabeller ved hjelp av parametre og variabler. Excel har et nyttig verktøy som kan rydde i henhold til en eller flere variabler av ditt valg. […]

11. Hvordan sortere data